U.S. Tourism & Travel Statistics 2020-2021
The Ultimate Fact Guide to America’s Tourism Industry Including Outbound, Inbound, Domestic & Business Travel Figures.
The American tourism industry is thriving, International and domestic travel is currently contribution over $1.1 trillion to the United States GDP every year. When looking at the annual travel split of domestic and international travel, Americans domestically traveling within the country last year made up the lions share, totaling 2.29 Billion, a 2% increase from the previous year. Following past US tourism trends, the volume of Americans outbound traveling internationally was of course much less, amounting to 79.6 Million, which was a 3.5% increase from the previous year.
Leisure based travel accounts for 73.8% of all tourism in America, leaving 26.2% for business and other reasons. Overall the tourism expenditure accounts for $1,089 Billion a year, and the industry provides a direct source of employment for 5.29 million jobs.

TOP U.S. TOURISM STATISTICS:
US Citizen domestic tourism: Americans take 2.29 Billion domestic trips each year.
US Citizen outbound tourism: Americans take 93.0 Million international outbound trips each year.
International Inbound Tourism: Annually, there are currently 79.6 Million international visitors to the US.
$1,089 Billion: Yearly American tourism expenditure ($932.7b domestic / $156.3b international)
Expenditure sources: $267.7B on food services, $232.2B on lodging, $200.4B on public transport, $166.5B on auto transportation, $112.6B on recreation, $109.6B on retail.
15.7 Million American jobs were supported by travel in 2018.
By 2028, yearly U.S. tourism is estimated to hit the $2.4 trillion mark.
Days/yr. traveled by age group: Gen Z (29 days) , Millennials (35 days) , Gen X (26 days) and Baby Boomers (27 days).
Top 5 inbound countries: Mexico (19.1m), Canada (12.3m), UK (4.9), Japan (3.4), China (2.9)
Top 5 outbound by continent: Europe (17.7m), Caribbean (8.7m), Asia (6.2m), South America (2.1m), Central America (3.2m)
Top US cities visited: New York (9.8m), Miami (5.38m), LA (4.98m), Orlando (4.47m), San Francisco (3.57m), Vegas (3.33m)
Business vs. leisure: U.S. travelers took 466.2 million domestic trips for business (26.2%), and 1,779.7 million for leisure (73.8%)
Quick Links: Navigate Our Statistic Topics
US INBOUND & OUTBOUND TOURISM STATISTICS
How many Americans travel out of their country a year?
US domestic travel increased by +2% YTD in 2019 with Americans taking 2.29 Billion domestic trips.
Domestic leisure travel increased 1.9% in 2019 to 1.9 billion.
80% of all US domestic trips were for leisure travel in 2019.
Domestic business travel in 2019 accounted for 464 million trips.
US Citizen outbound tourism: Americans take 93.0 Million international outbound trips each year. (+6.3% YTD Change)
International Inbound Tourism: Annually, there are currently 79.6 Million international visitors to the US. (+3.5% YTD Change)
Top 5 inbound countries: Mexico (19.1m), Canada (12.3m), UK (4.9), Japan (3.4), China (2.9).
Top 5 outbound by continent: Europe (17.7m), Caribbean (8.7m), Asia (6.2m), South America (2.1m), Central America (3.2m).
Top US cities visited: New York (9.8m), Miami (5.38m), LA (4.98m), Orlando (4.47m), San Francisco (3.57m), Vegas (3.33m).
Each year, 35% of American families plan vacations 50 miles or more from home.
In a Travel Leaders Group survey, 24% of Americans stated they plan to travel to Europe.
22% of American vacations are via road trips.
USA’s top 5 road trip routes: #1 Las Vegas – National Parks, #2 Northern California – Southern Oregon Coast, #3 Northern New England, #4 Blue Ridge Parkway #5 Black Hills.
The lion’s share of the United States tourism is from its own citizen’s domestic travel, with over 2.29 billion Americans taking trips within the country. This saw a +2% year to date increase, which is enormous considering that domestic travel spend was worth $932.7 Billion.
As you can see from the US outbound travel statistics above, the number of Americans traveling out of the country is remarkably low compared to domestic travel. According to Trade.gov, outbound tourism hit 93 Million last year and saw a sizable +6.3% year to date increase, showing more Americans are willing to take an outbound trip and travel out the country.
The outbound travel expenditure of these 93 million people was worth $156.3 Billion to America’s tourism industry, so 6.3% is a very significant outbound tourism statistic! The hottest US outbound destinations were Europe, Caribbean, Asia, South America, and Central America.
The US inbound tourism statistics also paint a fascinating picture of America’s continued tourism industry growth, with visitors flocking from Mexico, Canada, UK, Japan, and China. International visitors totaled 79.6 Million with a 3.5% year to date increase, with the top US vacation destinations being cities such as New York, Miami, LA, Orlando, San Francisco, and Las Vegas.
AMERICAS TOURISM INDUSTRY SPEND STATISTICS
How much did Americans and Tourists spend on travel last year?
American’s spent around $930 billion USD on domestic travel in 2018.
In 2017 the amount spent on summer vacations was around $101.1 billion USD , up from $89.9 billion in 2016.
$1.1 Trillion / $1,089 Billion: Yearly U.S. travel and tourism expenditure ($932.7b domestic / $156.3b international).
U.S. leisure spend totalled $761.7 billion in 2018 from domestic and international travellers.
U.S. business sped totalled $327 billion in 2018, with $136 Billion from travellers attending conventions or meetings.
Expenditure Sources: $267.7B on food services, $232.2B on lodging, $200.4B on public transport, $166.5B on auto transportation, $112.6B on recreation, $109.6B on retail.
Behind nightlife/dining, travel was voted America’s most popular choice for spending disposable income at 36%.
$101.1 Billion is spent every year in America on summer vacations alone.
The average American spends $6,080 on international trips.
Inbound overseas tourists stay an average of 18 nights and spend $4,200 while in America.
Overseas travellers account for 84% of international tourist spend, despite being half of all international arrivals.
Canadian tourists are the biggest spenders with £22.2 billion in the U.S. every year.
New York brings in $16.1 Billion a year from international visitors.
If you’re wondering how much Americans spend on travel each year, it was huge; International and domestic travelers spent $1.1 Trillion US dollars ($1,089 Billion). Americans spending through domestic travel increased by a massive +5.8% year to date, whereas international tourism spends only saw a 0.3% bump from the previous year. To break this down, this sort of spending would support 8.9M jobs, which in turn would generate $171 Billion in tax and $268 Billion in payroll.
Out of the $1.1 Trillion spending, leisure travelers from both international and domestic spent $762 Billion in 2018, which was a +6.1% increase from the previous year. When looking at business travel spend, it had risen +2.4% to $327 Billion, with 41.5% coming from
What are American tourists spending this $1.1 Trillion on? According to the latest US travel spending statistics, food services such as restaurants, bars, and grocery stores were the most popular spending category at 26.7%. This was followed by 23.1% on lodging, 20.0% on public transport, 16.6% on auto transportation, 11.2% on recreation, and 10.9% on retail.
Furthermore, this $1.1 Trillion spending isn’t the only financial impact of the tourists. When you look at the inputs used to supply or produce the goods travelers desire, and take into account the spend of the employees of travel businesses – there is a considerable multiplier of the financial impact to the US economy, estimated to be a total of $2.5 Trillion.
US TRAVEL AND TOURISM INDUSTRY JOB STATISTICS
How much is the travel industry worth to America?
The travel industry accounts for 7.1% of America’s private employment.
15.7 Million American jobs were supported by travel in 2018.
8.92 Million American travel-related jobs were supported by tourism in 2018 (7.73M domestic / 1.19M international)
$1 Million in travel revenue directly produces eight jobs with the industry.
1 in 10 jobs in the U.S. depend on the travel industry (Excluding farming).
$267.9 Billion in payroll is generated yearly by U.S. travel and tourism ($234.6 Billion domestic / $33.3 Billion international).
$170.9 Billion in tax revenue is generated yearly by U.S. travel and tourism ($147.3 Billion domestic / $23.6 Billion international).
A massive $117.4 billion of the $170.9b in tax revenue was spent on leisure travel, $53.5b on business.
International and domestic business travel generated $327.3 billion in 2018 through direct spending.
In 2018, U.S. residents recorded 463.6M trips for business (38% being events and meetings).
The tourism industry is vital to the US economy, so much so that it accounts for 7.1% of the countries private employment. Overall, 15.7 Million American jobs were supported by the tourism industry last year, making one in eight non-farm jobs dependent on it in some way, direct and indirectly. The trend is on the up, the 15.7 Million American jobs in the travel industry had a +1.3% increase from the previous year.
Jobs, where workers are supplying goods or services directly to visitors, would be classed as ‘direct’ – this supported 8.9 million U.S. travel-specific jobs. The remaining 6.8 Million jobs were classed as indirect, these would include areas whereby workers created goods or services which helped produce the goods or services (sold or used by the 8.9M direct jobs).
The travel industry is known for being extremely labor intensive, its upwards trends have the power to develop new career opportunities much fast than any other niche. If you exclude the farming industry, one in ten jobs would be dependent on the travel industry – as an example, one in five non-farming industry jobs would be created from $1 million sales, but the same value in the travel industry would create one in eight.
US TRAVEL STATISTICS BY DEMOGRAPHIC
Which American age groups travel the most?
42% of Americans own a passport, up from 27% 10 years ago.
Days a year traveling by age: Millennials ( 35 days ), Gen Z ( 29 days ), Baby Boomers ( 27 days ), and Gen X ( 26 days ).
Millennials : 62% of parents travel with kids under five.
Millennials : 58% prefer traveling with friends, 49% book last-minute vacations.
Millennials : 58% want to solo travel, 26% already have.
Solo Travel Women: Take 3 more trips a year and are the most likely to travel alone.
Solo Travel: 43% take over three trips a year.
Solo Travel: 50% have a college or university diploma/degree.
Family: 4 out of 10 plan a trip with a family each year.
Family: 80% take summertime trips to travel with family.
Family: 42% opt for spring break vacations.
Baby Boomers: Aim to take 4+ leisure vacations a year.
Baby Boomers: 30% opt for a cruise as their vacation choice.
When analyzing the latest US outbound travel statistics by age, it was clear that millennials are the group willing to travel for the most extended period at 35 days a year, while generation X vacationed an average of 26 days.
Millennial Americans that are without children are now less of the typical ‘tourist’ and more of the ‘experience’ generation. Most of their booking habits are focused on exploring cultures, booking retreats, or activities rather than visiting theme parks and tourist trap areas. Their freedom and spontaneity let almost half of them book last-minute vacations, with or without friends as, to them, solo travel means cultural growth and meeting new people.
These travel age statistics also show us that half of the solo travelers take up to 3 more trips a year, have a college or university degree, and American solo travel is more prominent in women. What percentage of Americans own a passport? The myth was only one in ten do which appears in many blogs across the web, but now the Census and State department confirm that over 42% of Americans own a passport.
One travel by age group statistic shows almost one in three baby boomers opt for a cruise as their vacation and aim to take at least 4 trips per year. When it comes to families, the majority go during summer break (80%), and only 4 in 10 plan trips with their family. However, millennial families are far more likely to travel with younger children, at 62%.
REASONS AMERICANS TRAVEL FACTS & STATISTICS
Why do Americans travel?
Business/Leisure: U.S. travellers took 466.2 million domestic trips for business (26.2%), and 1,779.7 million for leisure (73.8%).
Family: 95% prioritised their family to be happy and entertained.
Family: 89% prioritised vacation deals and value.
Family: 85% needed planning around school holidays.
Family: 85% wanted outdoor activities for their family.
Gen Z: 55% travelled to increase their knowledge and experience.
Gen Z: 40% travelled to avoid stress and relax.
Millennials: 43% want to find themselves.
Millennials: 23% want to meet new people.
57% of U.S. travellers would choose a free heritage vacation over alcohol for a year.
56% of global international travellers agree it taught them life skills.
51% want to escape normal life and recharge mentally.
42% take trips to visit friends and family.
35% are travelling to experience local delicacies.
Top bucket list vacations are volunteering trips (39%), food travel adventure (38%), mystery journey (38%), ancestry/heritage trip (36%), and sabbatical (36%).
59% of solo travellers stated the reason they went alone is to see the world without waiting for others.
Why do Americans travel? When looking at the data from several survey sources, it was clear that the gender and age of respondents had little impact on the three most important factors.
The most important reasons why Americans travel were:
- Being with friends and family
- Fun experiences (did index higher in younger generations)
- Relaxing and unwinding
In terms of gender-based travel reasons, men indexed higher than women overall for exploring the great outdoors or outdoor activities that fall into that category. Generation Z, Millennials, or general age groups from 18-35 had higher responses around wanting to travel for music events or festivals than people aged 35 and over.
The most important trend we’ve noticed from reviewing multiple studies around American’s desires for travel is that younger generations are factoring in ‘experience tourism,’ this was very common in their responses. Experience tourism can be defined by people wanting to book activities or retreats, meet new people and ‘find themselves’. This is popular among solo travellers, like a cultural trip to Thailand for a detox retreat rather than visiting a traditional tourist attraction like a theme park.
Americans over 35 were keen on finding a vacation where food and drink was priority. Visiting a town or city that had cultural foodie scenes or breweries were very trendy.
US TOURISM & TRAVEL ACTIVITY STATISTICS
What are the popular trending activities in America?
Top 5 culture activities: #1) 65% visit history/art museums, #2) 59% visit aquariums, #3) 56% visit science museums, #4) 55% visit theme parks, #5) 55% visit zoos
73% of families take their children to a theme park, 34% aim for a world famous one.
Overseas visitors top 5 activities: #1) 54% Shopping, #2) 49% visit historical/cultural sights, #3) 49% Restaurants, #4) 46% Monuments / National Parks, #5) 46% Sightseeing tours.
Trending: 89% increase in sunset cruise excursions trips since last year.
Trending : 64% increase in snorkelling activities since last year.
Trending : 55% increase in sailing trips since last year.
Trending : 49% increase in kayaking and canoeing experiences since last year.
33% of visitors will get spa or beauty treatments while on vacation.
15% of travellers book mindfulness or meditation retreats.
One of the reasons Americans do not travel abroad that much is that there is so much to offer in their own country. There is a wealth of cultural activities such as art galleries, museums that index high on the popular activities list, not to mention the volume of theme parks, zoos, and aquariums across the country.
Families want to book all-inclusive trips where everything is taken care of, and they can focus on shopping or taking their children sightseeing. An overwhelming volume of people wanted to book a cruise in the future, which pairs well with relaxing is one of the most popular reasons for travel data above. Cruises were particularly popular in respondents over the age of 45, as well as self-guided tours, whereas group tours were one of the least popular options for booking.
Even though sporting related activities are trending up, going to a physical sporting event was one of the least popular reasons Americans book travel, with most wanting to support their team… from home.
What It Was Really Like For Native Americans Who Traveled To Europe
Much has been made of the various European-led conquests, expeditions, and contacts that deeply changed the fabric of Native American life beginning centuries ago. Whether that’s Christopher Columbus arriving in what’s now Puerto Rico in 1493, Vikings settling down in Canada, or any other similar tale, however, that’s not the whole story. As it turns out, the Atlantic Ocean has never been a one-way only journey. Plenty of people have been moving both west and east across its waters, including quite a few Native Americans who undertook wide-ranging voyages.
The stories of how Native Americans traveled from their homelands to Europe are as unique as the individuals that made these journeys. Some traveled in search of a better life, while others were stolen from their people and only made their way back home after years of travel. Some were greeted as royalty. Quite a few were treated as exoticized spectacles, while others may have felt similarly about the European ways of life they encountered.
Furthermore, the Native Americans who were able to tell the tales of their travels had plenty to say about their experiences in the lands across the sea, presenting a complex view of societies that would interact with native ones for generations to come. Here’s what it was really like for Native Americans who traveled to Europe.
A Native American woman likely visited Iceland 1,000 years ago
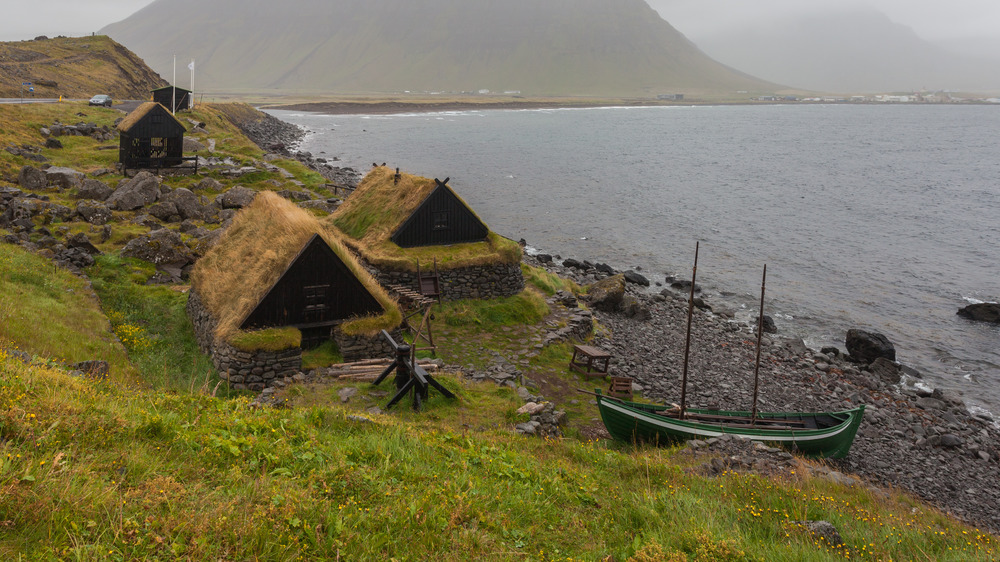
Many people likely believe that Native American people first visited Europe sometime after Europeans made contact, perhaps when Christopher Columbus first arrived in North America in the late 15th century, or Hernan Cortes brought down the Aztec capital of Tenochtitlan in 1521. However, that’s not actually the case. For one, according to UNESCO, the L’Anse aux meadows site in Newfoundland, Canada, has produced clear evidence that Norse people had briefly settled on North America’s Atlantic Coast some time in the 11th century. What’s more, that Viking connection could very well mean that one of the first native people to visit Europe actually did so more than a millennia ago.
This surprising revelation didn’t come about because of archaeological excavations as much as it did through the work of modern-day geneticists. The Guardian reports that scientists undertaking a gene-mapping survey of people in Iceland found that some modern people there carried genes that were clearly from a Native American woman. Next to nothing is known about her life, but it’s likely that she was taken by or traveled of her own accord with Vikings from her North American home to the southern coast of Iceland sometime in the year 1000.
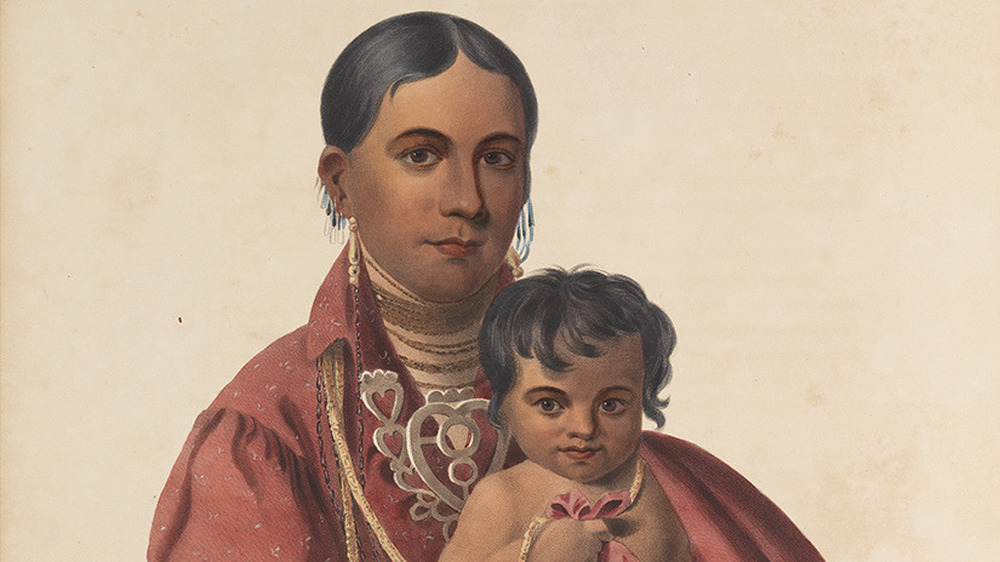
Pocahontas saw 17th century London

Much has been made of the life of Powhatan woman Pocahontas. As Smithsonian Magazine reports, “Pocahontas” was actually a nickname, while she more often would have gone by Amonute or, in more private contexts, Matoaka. Per History, she did meet English explorer and vagabond John Smith, but that’s where the similarities with Disney end. Pocahontas was eventually abducted by English colonists and made to live their lifestyle, complete with baptism, a new name, and marriage to tobacco farmer John Rolfe.
By 1616, Pocahontas was “Rebecca Rolfe.” The Virginia Company, which had funded the English colony, pushed for her to travel back to Europe in part to show that they had achieved the goal of converting Native Americans. Pocahontas would have also been a convenient figurehead for fundraising. In 1616, she, her husband, their infant son, and a small group of Powhatan people sailed for England.
Once in London, the National Archives reports, Pocahontas was treated as both royalty and curiosity. She attended a ball held by King James I, met the queen, and even met John Smith again. In 1617, Pocahontas and her party were set to return to Virginia, but she took ill soon after they set sail. She died in Gravesend, Kent, probably aged only 21. Her husband and young son sailed for home, leaving her buried at St. George’s Church, as per Atlas Obscura.
Black Elk performed for Queen Victoria
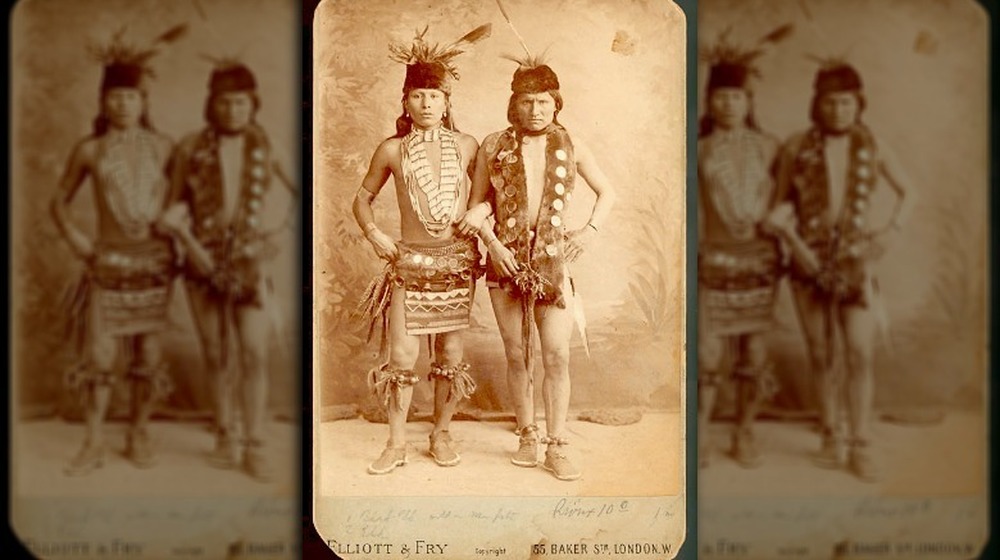
Black Elk, an Oglala Sioux from what would eventually become the state of Wyoming, saw much of the world. As per the National Park Service, he not only saw massive changes over the course of his life from the 1860s to 1950, but he traveled widely as part of the popular Wild West Show. Black Elk joined Buffalo Bill Cody’s show in 1886, hoping to better understand the world of white people to help the Sioux through a tumultuous and oftentimes cruel transition away from native life.
Black Elk and other Native American people traveled to England in 1887 as part of the show. As ThoughtCo reports, that’s also where Queen Victoria happened to be preparing for her Golden Jubilee celebrations in honor of her 50th year as monarch. She wanted to see Buffalo Bill’s show and, being the queen, Victoria got what she wanted.
That’s where Black Elk first saw the queen, says American History (via HistoryNet), whom he called “Grandmother England.” Only Victoria and her entourage were in attendance for the full performance. Black Elk and other Indigenous performers danced for her. As Black Elk recalled, “she was little but fat and we liked her.” After shaking hands with her post-performance, he reported that “Her hand was very little and soft.” Victoria, for her part, later wrote in her diaries that the Native Americans looked “alarming.”
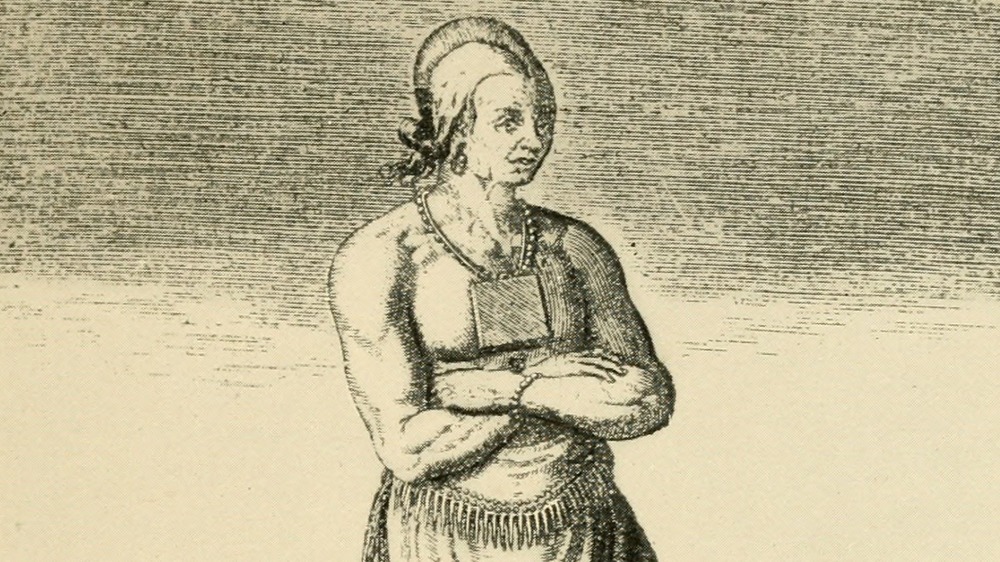
Squanto returned from his journey to find devastation
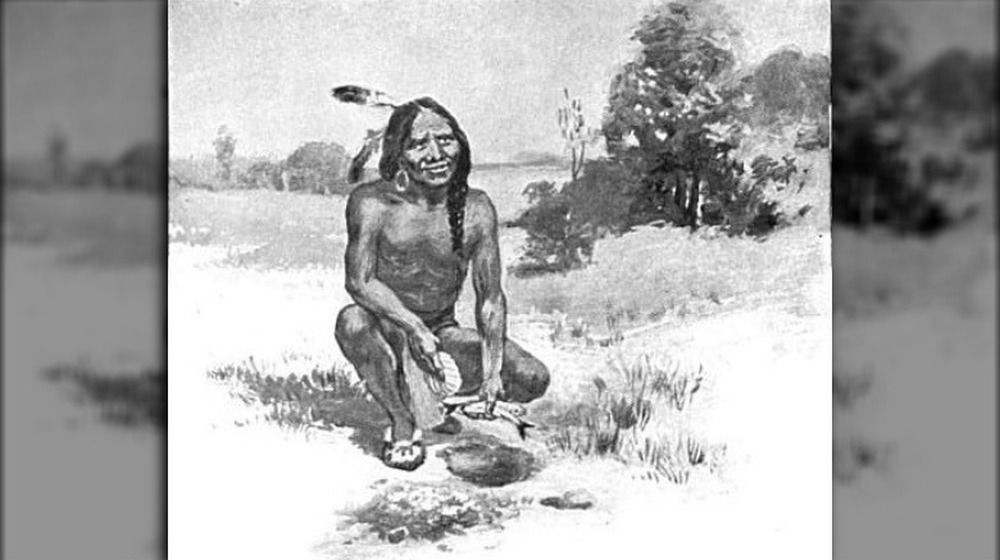
Though generations of American schoolchildren knew him as “Squanto,” the man who would eventually act as a liaison between the Pilgrims and Native Americans was actually named Tisquantum. And, in contrast to the simplified and oftentimes overly cheerful retellings of his part in early American colonial history, the true story of Tisquantum is one full of tragedy.
As Smithsonian Magazine reports, in 1614, a group of Patuxet people went out to meet a ship that had appeared nearby. On board they met captain John Smith — yes, that John Smith — in a peaceful encounter. Later, however, Smith’s associate, Thomas Hunt, lured another group of Patuxet aboard and took them captive. Those that survived the fight were sailed back to Europe and sold into slavery, including Tisquantum.
The Revealer says that he was first sold in Spain to a group of Catholic priests who hoped to convert him. He eventually left them, went to England, and finally returned to Massachusetts six years after he left. Yet, when he arrived, Tisquantum found his people wiped out by disease and the Puritan settlement of Plymouth in their place. And while Tisquantum did help the people there, he also played hostile Indigenous people against one another, perhaps seeking some small amount of stability for himself. He later died of illness in Plymouth, having made himself a complicated figure in both native and colonial communities.
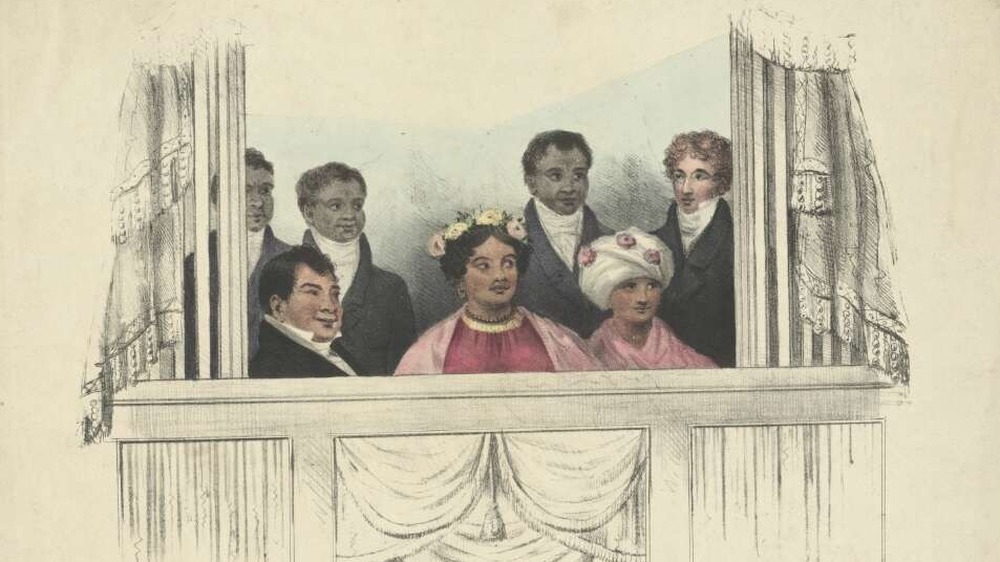
A group of Osage people traveled to France in 1827
In 1827, a group of six Osage people — four women and two men — undertook the long journey from their home in Missouri to France. Once in Europe, they were treated to plenty of acclaim and VIP experiences but were also gawked at and treated as “noble savages.” They also may have been kidnapped.
According to Osage News, it all began in Missouri with a group of 12 Osage people. Things went south relatively quickly when some of their boats overturned during a river crossing, causing six of the party to turn back. The other six finally made it to France after a three-month voyage east across the Atlantic, landing in July 1827. They were escorted by David Delauney, who intended to make money by exhibiting the group.
Once there, the group encountered some unique experiences, according to An Osage Journey to Europe. These included a ride in a hot air balloon and a meeting with the French king. Yet, as the group traveled throughout Europe, interest declined, and their finances began to dwindle. As the State Historical Society of Missouri says, Delauney was eventually thrown into debtors’ prison, leaving the Osage to their own devices. One woman, Sacred Sun, gave birth to twin girls and allowed a Belgian couple to adopt one baby. They eventually made it back home to Missouri after the Marquis de Lafayette helped pay for their return passage.
Garcilaso de la Vega crossed the Atlantic and became a famous writer

Born in 16th century Peru after the Spanish conquest of the region, Garcilaso de la Vega would cross both a continent and an ocean to land in Europe and build a new life there. According to the University of Notre Dame, he was the son of a conquistador and Isabel Suarez Chimpu Ocllo, an Incan noble and niece of a local ruler. Garcilaso was raised in the household of his father, Sebastian Garcilaso de la Vega y Vargas. The young boy, who was part of a group of people of mixed heritage that would be known as mestizos, came into contact with both traditional Incan culture and colonial Spanish practices.
Garcilaso was an intelligent child who was useful as a scribe for his father, as Britannica reports. In late 1560, the young man, also known as “El Inca,” traveled to Spain and enlisted in the Spanish army. He became a captain, then left and took on the mantle of a Catholic priest in 1597. Later, he began translating literary works and wrote his own famous historical accounts of Peru, which were published beginning in 1608.
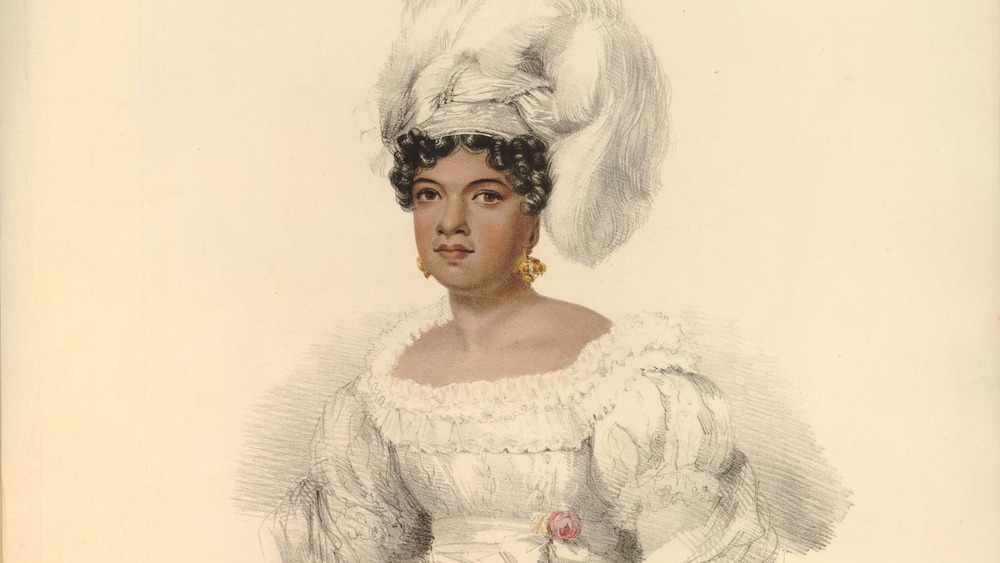
A trip to London was fatal for Kamehameha II and his wife
As author Shannon Selin explains, the trouble all began when Kamehameha II wrote to King George IV, pushing for British protection of the Hawaiian Islands and asking for his fellow monarch’s advice. Already in the first decades of the 19th century, Hawaii and its monarchy were facing numerous outside threats, from disease, to economic issues, to Americans ready to move in to exploit the island’s positions and resources. George IV basically gave Kamehameha II the cold shoulder and never replied to the letter. Kamehameha then commissioned a ship to take him, his favorite wife Kamamalu, and an entourage of Hawaiian representatives, straight to the British court. They landed in England in May 1824.
According to The Hawaiian Journal of History, many British newspapers simply recounted the retinue’s comings and goings, though a few were more overtly racist and disparaging of the king’s retinue, with one publication reminding its readers that the king “is still a savage” despite his Western dress and fine manners.
Though Kamehameha and Kamamalu traveled through London society and met with plenty of people, the meeting with George IV was frustratingly slow in coming. It was eventually scheduled but then delayed after the Hawaiian entourage caught measles. With practically no immunity to the disease, Kamamalu and Kamehameha died in quick succession in July 1824. The remaining Hawaiian dignitaries finally met with the British king in September before sailing home with the remains of their royals.
Wanchese left the Roanoke people for England
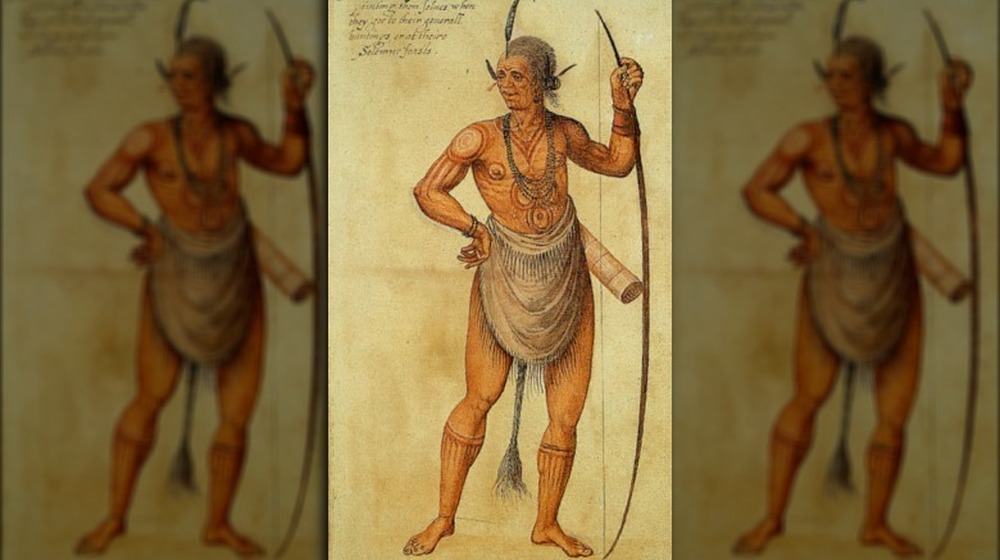
In 1584, Wanchese, a leader of the Roanoke tribe in modern day North Carolina, traveled to England as one of the first recorded Native Americans to make the crossing. According to the Coastwatch, he traveled with a fellow Native American, Manteo, as part of an effort by local leaders to establish friendly relations with English traders. The pair sailed with the Arthur Barlowe back to England, where they stayed for a time at the mansion of Sir Walter Raleigh. During their stay, they traded their clothing for Western-style garments, learned English, and taught some Algonquian to scientist Thomas Hariot. While they were being studied, however, both Wanchese and Manteo undertook their own mission to gather as much intel about these foreigners as they could.
Though both men returned home safely, something went sour for Wanchese along the way. As Indians and English: Facing Off in Early America reports, upon his return, Wanchese turned his back on any European contacts. Perhaps, having seen his fair share of British society up close, he had concluded that his Roanoke people were better off facing their native enemies on their own, without British backup. Certainly, as per the Dictionary of North Carolina Biography, he was no friend to the Europeans who settled on Roanoke Island in 1586, being part of the group of Indigenous people who drove the newcomers away.
Manteo traveled across the Atlantic for political reasons
As a pretty high-up member of Croatoan society, it wasn’t terribly shocking that Manteo would be chosen to represent his people in Europe. As the Dictionary of North Carolina Biography states, Manteo traveled to England by 1584 with another native person, the Roanoke man Wanchese.
Once there, the two men changed to British-style clothing and even visited the court of Queen Elizabeth I. Transatlantic Encounters says that they were there both to gather information for their tribes back home but also to make economic connections, both for themselves and for the associated Sir Walter Raleigh.
Where Wanchese grew distrustful of the English and eventually turned back from his associations with foreigners, Manteo maintained relations with the colonists. He may have even been baptized into the Anglican church upon his return to North America, which, as Transatlantic Encounters notes, would have made him the first known Native American to convert to Anglicanism. However, it appears that his conversion may have been only political, as it would have placed him in a potentially more advantageous position regarding the English who were slowly but surely invading his people’s lands.
Mesoamerican Totonac people visited Europe in 1519
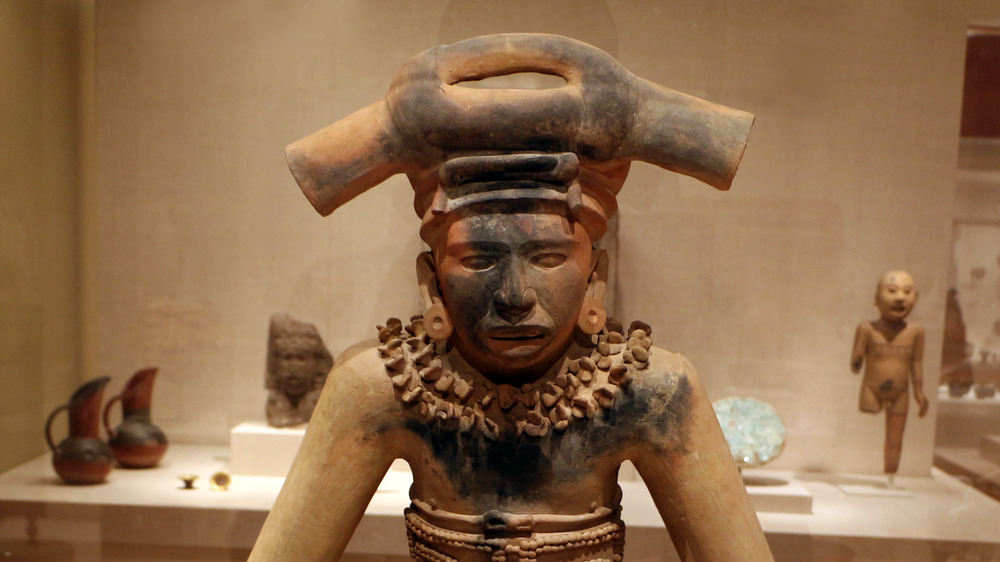
Some of the earliest recorded native visitors to Europe hailed from Mesoamerica. The American Historical Review reports that the Totonac people, who had allied themselves with Hernan Cortes against the Aztec inhabitants of Tenochtitlan, sent a small group to Spain in 1519.
However, scanty documentation means that not much is known about who exactly made the crossing and why. The group likely included both men and women and probably was sent in part to shore up royal support for Cortes, who had gone ahead with the conquest of Mexico without the go-ahead from the Spanish king.
When questioned by the Spanish court, the Totonacs carefully replied that they were definitely happy to have been baptized as Christians, and that all of the treasure they were handing over was a gift and not plunder Cortes had ripped from their lands. The truth of how the Totonac representatives really felt will likely never be known.
For their part, European observers were equal parts fascinated and horrified by the Mesoamerican visitors. German Renaissance artist Albercht Durer even came across the group and their gold, writing that he had seen “a sun all of gold a whole fathom broad, and a moon all of silver of the same size . very strange clothing, beds, and all kinds of wonderful objects of human use.” The awe-struck Durer concluded that he “marvelled at the subtle Ingenia of men in foreign lands.”
One English explorer kidnapped multiple Inuit people
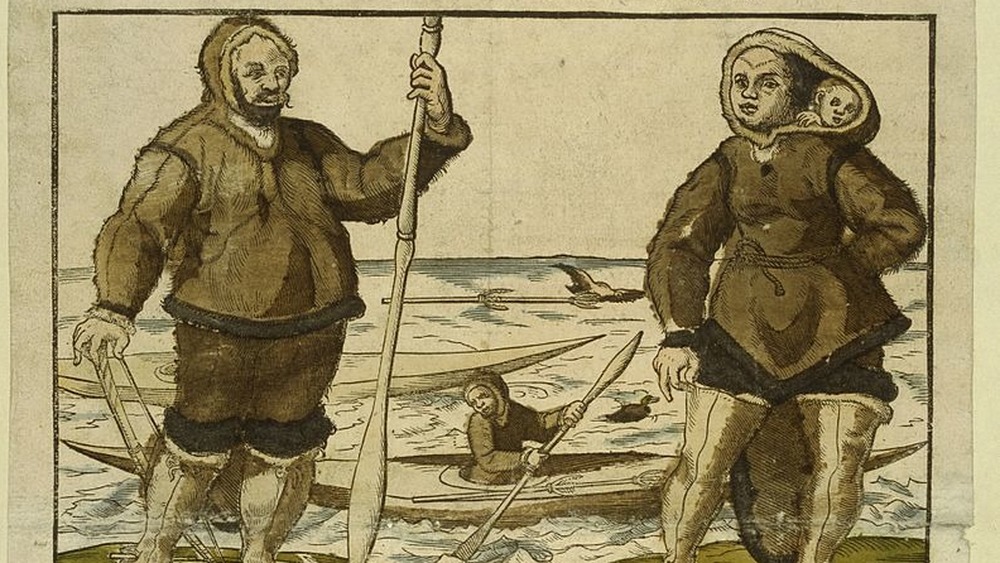
English explorer Martin Frobisher thought that he was going to make it big. Per Transatlantic Encounters, his 1576 expedition started off with Queen Elizabeth I waving at them from a window, a pretty good sign overall. But his attempt to find a northern passage through the Arctic to Asia, thus bypassing the troublesome North American landmass, was an utter mess. Out of his three-ship expedition, one sunk, one turned back, and only his flagship made it to Baffin Island in what’s now Canada. Yet, for the Inuit people living on Baffin Island, their luck would prove to be far worse than Frobisher’s.
Perhaps wanting to make up for an expensive and embarrassing failure, Frobisher abducted an unnamed Inuit man and sailed back to London by October 1576. The native man died only two weeks later, either from a self-inflicted wound or a respiratory disease.
Frobisher repeated this whole affair in 1577, when he returned to Baffin Island and stole three more Inuit people — a man, a woman, and her young child. Per Transatlantic Encounters, the man, Kalicho, died on November 7 of what appears to have been an infection and wounds received during his capture. The woman, Arnaq, died four days later of what was probably measles. A short time later, her son Nutaaq also died. Frobisher would later return to Baffin Island but took no more captives, presumably to the relief of the increasingly wary Inuit.
Pastedechouan’s trip to Europe proved tragic upon his return
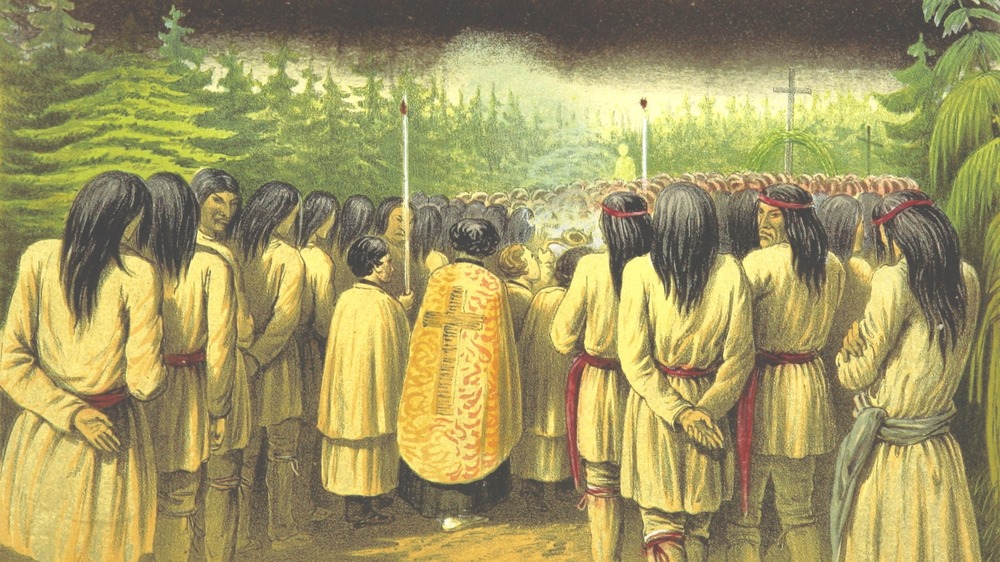
Some Native Americans adjusted as well as they could to their experiences in Europe. They either dressed as they normally did back home or adopted clothing more common to their new environment. Some learned European languages, while a few taught their own to foreigners. But some Native Americans had traumatic experiences that shaped the rest of their lives. That is perhaps nowhere more true than in the sad story of Pastedechouan.
According to the Dictionary of Canadian Biography, Pastedechouan was an Innu man born sometime before 1620, probably in Quebec. The Recollet religious order took a young Pastedechouan to France, had him baptized, and re-named him Pierre-Antoine. Pastedechouan was relatively well-educated by his religious foster family, learning both French and Latin. He returned to Quebec in 1626 but had trouble reconnecting with his Montegnais people, possibly because he had forgotten his native language.
Things did not exactly get better for Pastedechouan from there. In 1629, English forces came to invade Canada and recruited Pastedechouan as an interpreter, though he fled as soon as he could. He eventually left the Catholic faith but, apparently having trouble supporting himself and evidently dealing with alcoholism, often teamed up with missionaries out of financial necessity. As The Betrayal of Faith reports, it is in these moments that Pastedechouan becomes most pitiable — undone by drink, he rails against seemingly everyone in a world that, towards the end, seemed to hold little joy for him.
Travel and Tourism Statistics: The Ultimate Collection
What did Mr. Bradbury mean when he penned this now famous quote? We may never know.
Don’t get the wrong idea, of course. We get the part about travel being extra rewarding when people get far off the beaten path into places they didn’t even know existed. (Duh.)
What civilization will always wonder is this. Did he mean “half” in the general sense, as in give or take a third? Or “half” in the 50% sense, where if he’d meant 51 percent, he’d have said 51 percent?
Whatever the math behind Ray’s statistical calculations, one thing we know for sure…
People looooooove to travel.
Families and individuals of all ages, sizes and incomes. To faraway lands. For weekend getaways. To pursue new business deals. With kids. Without kids. On planes, trains, automobiles, boats and buses.
And when it comes to the best corporate discount programs, association member benefits, white-label rewards programs, and membership perks in general, discounted travel is often among the most hotly pursued additions to the mix. Why?
Because our hard-earned PTO is usually spent on travel. Because lots of money AND emotional expectation are wrapped up in most of our travel purchase decisions.
So to better understand today’s traveler, we at Access have compiled what we believe is a comprehensive “ultimate collection” of statistics having to do with the travel and tourism industry. We’ve tried to make this list as relevant as possible, which means we combed through recent research from travel and tourism related sources.
Most of these stats are focused on Americans who travel – though other nationalities may creep into the mix from time to time. We’ve provided source links for each statistic. Sometimes you’ll find the data conflicts with other sources – so we’ll leave it up to you to decipher which is most accurate.
We’ll keep this list updated regularly with the latest and greatest. If you know of a stat we’re missing, or want your own research included in our collection, leave us a note in the comments. Enjoy!

Travel Costs: How Much People Spend
- Americans are more willing to splurge on travel plans in 2022: 15% will upgrade rooms or flights, 16% will visit bucket-list destinations, 32% will splurge on the things that take a trip from good to great (Expedia)
- Travelers age 18-34 are the most likely to go big on their next trip (80% compared to 56% of travelers over 50) (Expedia)
- Gen X travelers are the most likely to splurge on a high-end restaurant (18%, compared to 16% overall) (Expedia)
- In 2021, premium economy ticket prices were around 290% more expensive than economy tickets, compared to pre-pandemic when they were 430% more expensive (Expedia)
- 68% of Americans are planning to go big on their next trip (Expedia)
- 40% of US travelers are more willing than ever to splurge on their future travels (Expedia)
- Global travel and tourism levels are projected to reach pre-pandemic levels in 2022, contributing nearly $2 trillion to the US economy (WTTC)
- U.S. domestic travel & tourism spending is forecast to reach more than $1.1 trillion for the year, surpassing pre-pandemic levels by 11.3% (WTTC)
- International traveler spending in the U.S. could reach $155 billion which is a growth of $113 billion, compared to 2020, though it would still be slightly below (14%) 2019 levels (WTTC)
- Employment travel and tourism could surpass pre-pandemic levels, reaching nearly 16.8 million jobs, which is above pre-pandemic levels by almost 200,000 jobs (WTTC)
- Airline losses from 2020-2022 could reach $200 billion (IATA)
- After reducing costs in 2021 by 34%, expenses are expected to rise again in 2022 due to expanded operations and higher fuel prices, averaging only 15% lower than pre-pandemic levels ( IATA )
- Boomers plan to spend the most of any generation: at least $4,000 on travel in the next 12 months (MMGY)
- With the rising price of fuel, domestic flight prices rose 36% in March 2022 from the beginning of the year to reach an average price of $300 (Bloomberg)
- The 2022 travel price index rose 12%, mostly driven by a 44% increase in motor oil ( US Travel )
- The January 2022 travel price index was 11.6% higher than 2019 levels (on par with consumer prices overall) ( US Travel )
- In January 2022, travel spending declined to $79 billion, this is down from $92 billion in December and down 11% from January 2019 levels ( US Travel )
- 50% of travelers would not pay extra for plane fare that offers free cancellation, 17% would pay up to $20 more, 16% would pay $20-$49 more and 9% would pay $50-$99 more ( Morning Consult )
- 56% of travelers would not pay extra for plane fare from a company that prioritizes pandemic safety, 17% would pay up to $20 more, 13% would pay $20-$49 more and 9% would pay $50-$99 more ( Morning Consult )
- 51% of Americans who traveled in the spring of 2021 plan to spend more when they travel in 2022, 23% plan to spend significantly more (Trip Advisor)
- Average spend per booking for US travelers in spring 2022 is up 87% year-over-year (Trip Advisor)
- American travelers are spending 29% more on their average booking in 2022 than they did in 2019, this is despite staying an average of 3.7 days, down from 4.4 days in 2019 ( Trip Advisor )
- The economic contribution of global tourism in 2021 is estimated at $1.9 trillion, above the $1.6 trillion in 2020, but still below the $3.5 trillion in 2019 (UNWTO)
- Global tourism spending is estimated to be $1,500 per trip in 2021, up from $1,300 in 2020 (UNWTO)
- In 2020, international travelers spent $83 billion compared to $233 billion in 2019, a loss of 64% (US Travel )
- In 2020, International travelers spent money on US goods and services (US Travel):
- Travel spending – $38.1 billion (compared to $139 billion in 2019)
- Passenger fares – $26.5 billion (compared to $40.1 billion in 2019)
- Education-related – $37.4 billion (compared to $44 billion in 2019)
- Health-related – $0.2 billion (compared to $1.2 billion in 2019)
- Border/seasonal workers – $7.6 billion (compared to $9.1 billion in 2019)
- US travel spending in 2020 totaled $680.3 billion ($642.2 billion domestic travel spending and $38.1 billion international spending) (US Travel)
- US travel spending in 2019 totaled $1,172.6 billion ($993.5 billion domestic travel spending and $179.1 billion international spending) (US Travel)
- In 2019 traveler spending totaled $1.1 trillion: $278.9B for food services, $242.3B for lodging, $210.8B for public transportation, $169.7B for auto transportation, $117.8B for recreation/amusement and $107.3B for retail ( US Travel Association )
Direct spending on leisure travel by domestic and international travelers totaled $792.4 billion in 2019 ( US Travel Association )
Direct spending on business travel by domestic and international travelers totaled $334.2 billion in 2019 ( US Travel Association )
In 2019, domestic travel spending grew 4.4% (for leisure grew 5.1%, for business grew 2.8%) ( US Travel Association )
Domestic travel expenditures industry breakdown for 2019 were: food services 25%, public transportation 20%, lodging 20%, auto transportation 17%, recreation/amusement 11%, retail 7% ( US Travel Association )
On average, Americans plan to spend $737 on their upcoming trip. Gen Xers will spend more than other age groups, and parents of kids under 18 plan to shell out more than $1,000 ( Value Penguin )
The average expense for a 4-night domestic vacation is $581 (or $144 per day): $224 for transportation, $150 for lodging, $155 for food/alcohol and $52 for entertainment ( Value Penguin )
The average expense for a 12-night international trip is $3,251 (or $271 per day): $1,755 for transportation, $683 for lodging, $520 for food/alcohol and $293 or entertainment ( Value Penguin )
Americans spend an average of $33 per day on food when on a domestic vacation, about 80% of which is spent in restaurants ( Value Penguin )
Americans spend an average of $35 per day on food when on an international vacation, about 90% of which is spent in restaurants ( Value Penguin )
2.7% of the nation’s gross domestic product (GDP) attributed to travel and tourism (US Travel Association)
Vacationing millennials (ages 18-34) spent, on average, $1,373 on summer vacations (Allianz Travel Insurance)
On average, Americans in the South spent less on vacationing ($564 on domestic and $3,169 on international) compared to the Northeast, Midwest, and West (Reward Expert)
Baby Boomers expect to take 4-5 leisure trips next year, spending up to $6,395 on travel expenses – the same or more than they spend in 2017 (AARP)
26% of American domestic travel expenses go towards food services, 20% towards public transportation, 20% towards lodging, 17% towards auto transportation, 10% towards recreation/amusement and 7% towards retail (US Travel Association)
Travelers who book their activities ahead of their trip spend 47% more on lodging than those who wait to book (Booking.com)
Lodging costs are about 26% of total travel expenditures for domestic trips, and 21% for international trips (Value Penguin)
On average, excluding airfare, 30% travelers aged 55-64 spend $1500-$2500 on a one-week trip (Solo Traveler)
Food plus alcohol take up about 16% of the budget for an American’s international trips, and about 27% of their domestic trips (Value Penguin)
Transportation costs make up 54.3% of international trip expenditures and 39.1% on domestic trips (Reward Expert)
More than 25% of travel costs go toward food for domestic travel and 16.2% for international travel (Reward Expert)
37% of travelers are very likely to splurge on food and drink experiences (WYSE Travel Confederation)
4% of travelers are likely to splurge on first or business class air fare (WYSE Travel Confederation)
The typical vacationing U.S. family spends about 44% of their travel funds getting to, from, and around their destinations (Value Penguin)
Travelers who book their activities ahead of their trip spend 81% more on transportation than those who wait to book their destination (Booking.com)
65.3% of Americans say that leisure travel is somewhat of a budget priority for them (Destiantion Analysts)
83% of families will splurge on their travel destination when planning a vacation, 68% on paid attractions, 68% on staying close to their destination, 63% on eating out/food and 63% on the length of their trip (NYU)
24% of solo travelers spend more than $1,500 for one week of vacation (excluding airfare) (Solo Traveler World)
Each overseas traveler spends approximately $4,200 when they visit the U.S. and stays on average 18 nights ( US Travel Association )
Flying coach instead of business saved business travelers $2,975 on average per round-trip flight (Rocketrip)
42% of Americans paid lodging costs for domestic travel vs. 60% for international travel, as domestic travelers often stay with family and friends ( Value Penguin )
Taking an early-bird flight saved business travelers $66 on average per round-trip flight (Rocketrip)
Managers saved an average of 15% per trip, $572 per year and took an average of 5 trips per year (Rocketrip)
Directors saved an average of 12% per trip, $684 per year and took an average of 6 trips per year (Rocketrip)
Vice Presidents saved an average of 11% per trip, $651 per year and took an average of 6 trips per year (Rocketrip)
CXOs saved an average of 9% per trip, $1,081 per year, and took an average of 8 trips per year (Rocketrip)
26% of Americans will use their rewards points or miles to fund their next vacation ( Value Penguin )
Vacation spending is equal to about 2% of the total budgets of all U.S. households annually ( Value Penguin )

Traveler Demographics: A Profile of People Who Travel
- Of travelers who subscribe to travel related paid subscriptions, 62% are male and 38% are female ( Trip Advisor )
- Of American travelers who subscribe to a travel related paid subscription program, 11% are between the ages of 18-24, 26% are 25-34, 22% are 35-44 and 25% are 55+ ( Trip Advisor )
- Millennials are planning to take the most trips of any generation: an average of 4.4 trips in the next 12 months (MMGY)
- 52% of active leisure travelers are members of at least one hotel loyalty program, and 48% have joined at least one airline loyalty program (MMGY)
- Millennials are 11-percentage-points more likely to stay at a chain hotel than the general population ( Morning Consult )
- Travelers with an income of less than $50,000 are the least likely to say price is a top priority ( Morning Consult )
- 42% of US Adults who took more than 3 business trips per year pre-pandemic expect to never travel for business again, 14% expect to take a business trip after more than a year, 10% within 7-12 months, 13% within 4-6 months, 13% within 1-3 months and 7% in less than a month ( Morning Consult )
- More employed travelers anticipate taking a blended trip (combining business and leisure travel) in the next year: 40% with an even split between business and leisure, 40% blended primarily business and 44% blended primarily leisure. 41% of travelers anticipate taking a business only trip this year and 76% taking a leisure only trip ( Morning Consult )
- Millennials are the most likely to stay at a hotel in the next 3 months at 39%, followed by boomers (28%), Gen X (23%) and Gen Z (9%) ( Morning Consult )
- 75% of travelers who plan to stay in a hotel in the spring of 2022 are vaccinated and 16% are unvaccinated ( Morning Consult )
- 6% of all US adults will stay in a vacation rental in the next 3 months ( Morning Consult )
- 20% of travelers with travel plans in the next 3 months expect to stay in a vacation rental ( Morning Consult )
- Millennials are the most likely to stay in a vacation rental at 46%, followed by Gen X (17%), boomers (16%) and Gen Z (21%) ( Morning Consult )
- US adults who have imminent travel plans are more likely to want precautions from travel brands ( Morning Consult )
- Travelers predict they will next travel for leisure in 1 month (11%), 1-3 months (22%), 4-6 months (22%), 7-12 months (13%), in more than a year (19%) and never (12%) ( Morning Consult )
- Travelers of all demographics are more comfortable traveling now than they were during the height of the Omicron outbreak, with high income earners and previous travelers reporting feeling the most comfortable ( Morning Consult )
- In March 2022, more than half of US adults said they would travel for leisure in the next 6 months, up 6 percentage points from January 2022 ( Morning Consult )
- Travelers who traveled 3 or more times a year before the pandemic (who are likely to be millennials and high income earners) are the most likely to be planning a trip soon ( Morning Consult )
- While travelers in the US and many European countries are more confident about taking a leisure trip in the next 6 months, many East Asian travelers are less confident. For example, from October 2021 to March 2022: ( Morning Consult )
- US travelers saw a 5-percentage-point increase in confidence (from 50% to 55%)
- German travelers saw a 17-percentage-point increase in confidence (from 46% to 63%)
- UK travelers saw a 13-percentage-point increase in confidence (from 44% to 57%)
- China travelers saw a 10-percentage-point decrease in confidence (from 47% to 37%)
- Japan travelers saw a 6-percentage-point decrease in confidence (from 33%) to 27%)

Travel Destinations: Where People Go When They Travel
- The top 3 destinations for outdoor enthusiasts because of national parks and natural wonders are: 1. Arenal Volcano National Park, Costa Rica 2. Jim Corbett National Park, India and 3. Serengeti National Park, Tanzania. The top US destination for outdoor enthusiasts is Denali National Park and Preserve, Alaska (TripAdvisor)
- The top 3 destinations for food lovers because of restaurants and restaurants and foodie experiences are: 1. Rome, Italy 2. London, UK and 3. Paris, France. The top US destination for food lovers is New York City, New York (TripAdvisor)
- The top 3 destinations for big city lovers are: 1. Dubai, United Arab Emirates 2. London, UK and 3. Rome, Italy. The top US destination for big city lovers is Las Vegas, Nevada (TripAdvisor)
- The top 3 destinations for sun seekers because of pristine beaches and clear waters are: 1. Cancun, Mexico 2. Bali, Indonesia and 3. Crete, Greece. The top US destination for sun seekers is Oahu, Hawaii (TripAdvisor)
- The top 3 destinations for skiers are: 1. Zermatt, Switzerland 2. Jackson, Wyoming and 3. Banff, Alberta (TripAdvisor)
- Secluded mountain / rural escapes and waterfront getaways are the most popular vacation rentals of 2022 (Evolve)
- Only 15% of travelers booking vacation rentals are headed to urban areas in 2022 (Evolve)
- 27% of travelers favor international trips despite restrictions still in place (Evolve)
- There was a 4% rise in international tourist arrivals in 2021 from the previous year, meaning it was still down 72% from pre-pandemic levels (UNWTO)
- The pace of international tourism recovery has been uneven due to varying degrees of restrictions, vaccination rates and traveler confidence. Europe recovered 19% over 2021 and the Americas recovered 17%, while Asia and the Pacific arrivals fell 65% below 2021 levels (UNWTO)
- 71% of travelers who plan to stay in a vacation rental are vaccinated and 20% are unvaccinated ( Morning Consult )
- 7 of the 10 fastest growing destinations for spring 2022 (based on YOY growth) are outside the US (Trip Advisor)
- Paris, London and Rome are the top three trending international travel destinations for spring 2022 (Trip Advisor)
- Orlando, Florida will welcome the most visitors overall in spring 2022, and Hawaii will see the greatest YOY growth from spring 2021, likely the result of relaxing its travel restrictions (Trip Advisor)
- The top 5 most popular spring travel destinations are: Orlando, Florida; Las Vegas, Nevada; Cancun, Mexico; Key West, Florida; Miami Beach, Florida (Trip Advisor)
- The top 5 fastest growing spring travel destinations are: Honolulu, Hawaii; Paris, France; Lahaina, Hawaii; London, United Kingdom; Rome, Italy (Trip Advisor)
- 65% of leisure travelers did not travel internationally in 2020 (TripAdvisor)
- 47% of travelers globally say they plan to travel internationally in 2022 (TripAdvisor)
- 30% of travelers globally say won’t travel internationally in 2022 (TripAdvisor)
- 11% of travelers have already booked an international trip for 2022 and an additional 17% say they are researching international trips with the intent to book (TripAdvisor)
- 13% of US travelers have booked an international trip in 2022 (TripAdvisor)
- Hotel searches for trips in Jan-Apr 2022 are predominantly for domestic locations, while searches for trips in May-Dec 2022 are predominantly for international locations (TripAdvisor)
- 77% of travelers globally say they will be more likely to travel internationally, and 86% domestically, if they receive the COVID-19 vaccine (TripAdvisor)
- 34% of US travelers say they are much more likely to take an international trip in 2022 once they’ve received the vaccine (TripAdvisor)
- 26% of travelers globally, 30% of US travelers, say they will only travel to destinations that require visitors to be vaccinated before travel (TripAdvisor)
- 64% of people who plan to travel in 2022, plan to take 2+ domestic trips (TripAdvisor)
- 60% of people who plan to travel in 2022, plan to take local trips (TripAdvisor)
- In the first week of January, nearly 70% of hotel clickers on Tripadvisor were booking domestic trips (TripAdvisor)
- Globally, 74% of travelers plan to take at least one domestic trip, and 45% plan at least 2 domestic trips, in 2022 (TripAdvisor)
- 34% of US travelers are planning at least three domestic trips in 2022 (TripAdvisor)
- 56% of Americans have taken a staycation recently (YouGov)
- 2020 Google searches for “staycation” have jumped 45% YoY (Google)
- AAA estimates Americans will make 700 million car trips from July-Sept 2020 (AAA)
- Popular hotels are selling out nationwide during the pandemic. (CNN)
- Post-pandemic “revenge spending” indicates travel will be among the first industries to recover. (Forbes)
- Weekly pent-up demand for post-pandemic travel continues to grow . (TravelPulse)
- Top destinations in 2019 were predicted to be The Turkish Riviera, Egypt, The Peloponnese, Matera, Perth, The Scottish Highlands, St Barths, Arles, Valle de Guadalupe and New Orleans (CN Traveller)
- The Southeast region of the U.S. (Florida, Georgia, Louisiana) captured the largest share of domestic online searches for vacation lodging at 34% followed by the Far West (Washington, Oregon, California, Nevada) at 23%, the Mideast (New York, New Jersey, Maryland, Delaware, Pennsylvania) at 14%, the Southwest (Arizona, New Mexico, Texas, Oklahoma) at 11%, Great Lakes Region (Wisconsin, Illinois, Indiana, Michigan, Ohio) at 7%, Rocky Mountain Range (Idaho, Utah, Wyoming, Montana, Colorado) at 5%, the Plains Region (North Dakota, South Dakota, Nebraska, Kansas, Minnesota, Iowa, Missouri) at 3% and the New England Region (Vermont, New Hampshire, Rhode Island, Connecticut, Massachusetts, Maine) at 3% (US Travel Association)
- Top 10 U.S. destinations for travel agencies in 2018 include: Alaskan Cruises (47.9%), Orlando (38.6%), Las Vegas (35.4%), Maui (30.9%), NYC (27.7%), Honolulu (25.7%), Hawaiian Cruise (16.5%), Miami/Miami Beach (15.5%), Washington D.C. (14.7%), Los Angeles (12.9%) (Travel Leaders Group)
- Top 10 international travel locations for travel agencies in 2018 include: Caribbean Cruise (34.7%), Cancun (28.3%), Cruise – Europe (River) (23.1%), Cruise – Europe (Mediterranean) (17.4%), Punta Cana, Dominican Republic (17.2%), Rome (16%), London (15.5%), Amsterdam and Montego Bay, Jamaica (12.6%), Playa del Carmen/Riviera Maya, Mexico (11.4%), and Pairs (11.1%) (Travel Leaders Group)
- Most popular 2019 destinations for American travelers are Florida (17%), California (11%), New York (5%), Texas (5%), and Las Vegas (5%) (AARP)
- The top five summer road trip routes are: Las Vegas to National Parks, Northern California and Southern Oregon Coast, Northern New England, Blue Ridge Parkway in North Carolina, and Black Hills in South Dakota (AAA)
- Top 2019 international destinations include Europe (41%), the Caribbean (20%), and Asia and the Middle East (11%) (AARP)
- Iceland welcomed 2.2 million foreign travelers in 2017, with 32.9% of arrivals being in the winter months (Iceland Tourist Board)
- Australia is the number one international destination for solo travel (Booking.com)
- 38% of Millennial travelers are likely to visit a major metropolitan city in the next year (Resonance Consultancy)
- 50% of Americans, 89% of Indian people, and 69% of French people have traveled to at least one country of their ancestry (Forbes 2019)
- 40% of Millennial travelers are likely to visit a beach resort in the next year (Resonance Consultancy)
- Traveling to Mexico has dropped from 22% in 2017 to 9% for 2018 (AARP)
- Travel to the United Kingdom has dropped from 15% in 2017 to 6% for 2018 (AARP)
- Travel to Canada has dropped from 17% in 2017 to 4% for 2018 (AARP)
- 7% of millennials, 3% of Gen X and 6% of Baby Boomers expect to travel only to international destinations (AARP)
- 42% of Millennials, 51% of Gen X, and 51% of Baby Boomers expect to travel only to domestic destinations (AARP)
- 51% of millennials, 46% of Gen X and 43% of Baby Boomers expect to travel to both domestic and international destinations (AARP)
- 75% of people travel within the U.S. and farther than a bordering state (Travel Leaders Group)
- 39.8% of people travel internationally (Canada, Mexico, and/or Caribbean) (Travel Leaders Group)
- Last year international tourist arrivals worldwide reached 1.4 billion (Stuff)
- 39.5% of people travel within their home state (Travel Leaders Group)
- 33.1% of people travel to a bordering state (Travel Leaders Group)
- 24% of Americans travel internationally (Europe) (Travel Leaders Group)
- 35% of Americans, are planning to take a vacation of 50 miles or more away from home involving two or more immediate family (AAA)
- 55% of families have taken their children on vacation to Florida, 31% to California, and 26% to New York (NYU)
- 41% of travelers aged 65+, go on cruises for vacation (Solo Traveler)
- 43% of families have traveled to a National Park with their children for family vacations (NYU)
- Road trips represented 22% of vacations taken by American travelers in 2016 (MMGY Global)
- 53% of traveling families expect to pack up their cars for a road trip this year (Travel Agent Central)
- 57% of global travelers take a beach vacation (Trip Advisor)
- 56% of global travelers choose a destination to explore city history (Trip Advisor)
- 52% of global travelers go on vacation to visit family/friends (Trip Advisor)
- 26% of global travelers go on vacation to attend an event or festival (Trip Advisor)
- 25% of U.S. destination selectors say they actively research new trips at least once a month (Phocuswright)

Reasons & Decisions: Why People Travel & How They Decide
- The most popular reasons for travel cited by American travelers include: rest and relaxation (51%), escaping day to day life (49%) and visiting family and friends (44%) (Trip Advisor)
- 34% of travelers would be significantly less likely to travel if scientists determine Omicron is more resistant to current vaccines, 32% if scientists determine Omicron is more easily transmitted (MMGY)
- Vaccinated travelers are on average more cautious than unvaccinated travelers (MMGY)
- Business travel sentiment improved in February 2022 to 89% ( US Travel )
- Nearly 9 in 10 companies are planning business travel in the next 90 days (as of Feb 2022) ( US Travel )
- 82% of American travelers are excited to travel in the next 12 months—the highest level since the start of the pandemic ( US Travel )
- 82% of business travel organizations felt their employees were willing to travel in February 2022, up from 54% in January ( US Travel )
- 40% of US travelers want the feeling that they have made the most out of their trip (Expedia)
- 37% of US travelers admit to being less spontaneous since the onset of COVID-19, but 25% are willing to be more spontaneous and another 26% are aiming to be more flexible this time around (Expedia)
- 24% of travelers plan to spend less time on their devices and be more present (Expedia)
- 27% of travelers aim to spend more time at their destination in order to fully experience all it has to offer (Expedia)
- Of travelers who combine business and leisure travel into a trip consider this a major motivating factor: ( Morning Consult )
- Makes the trip more fun (46%)
- Less expensive fares because of flexible timing (43%)
- Visit friends and family more often (43%)
- Travel to places you couldn’t otherwise (44%)
- Save on costs because employer covers part (43%)
- Earn more loyalty/rewards points (37%)
- to relax (56%)
- to spend time with friends and family (56%)
- to escape/get away (55%)
- to experience adventure (27%)
- to improve mental health (27%)
- to seek out cultural experiences (19%)
- to check a location off a bucket list (15%)
- to spend time on one’s own (14%
- to attend a specific event (13%
- to experience luxury (9%)
- to improve physical health (8%)
- Is reliable or dependable (85%)
- Has good customer service and is responsive to problems (84%)
- Protects customers’ data, privacy and security (83%)
- They have a good safety record (83%)
- They make me feel secure and safe (83%)
- Consistently delivers on what they promise (82%)
- Is a good value for the price (82%)
- Treats customers well , even in tough times (82%)
- They regularly clean and sanitize (81%)
- Has always treated me well (80%)
- They mistreat passengers’ luggage or personal possessions (86%)
- They have surprise fees (85%)
- You had a bad experience with them or their customer service (85%)
- They do not follow clear safety precautions (85%)
- They had a data breach and your personal information was compromised (85%)
- They are known for not being reliable (84%)
- They do not regularly clean or sanitize (84%)
- 85% to see my child excited about the experience
- 82% to relax/reduce stress
- 81% to make memories
- 78% for fun, excitement, and adventure
- 73% to see or do something new
- 72% to see more of the world
- 66% to strengthen relationship with a significant other
- 65% to strengthen bonds with family and friends
- 60% to improve outlook on life
- 55% to learn something new about a place, culture or history
- 40% to continue a family tradition
- 35% to cross off an item on bucket list
U.S. travelers took 466.2 million domestic trips for business, and 1,779.7 million for leisure (Statista). That compares with 458.9 million domestic business trips (Statista) and 1,745.5 million domestic trips for leisure purposes (Statista) in 2016
International arrivals to the U.S. totaled 79 million in 2019, about half of whom came from overseas ( US Travel Association )
U.S. residents logged 1.9 billion person‑trips* for leisure purposes and 464.4 million person-trips* for business * Person-trip defined as one person on a trip away from home overnight in paid accommodations or on a day or overnight trip to places 50 miles or more away from home ( US Travel Association )
U.S. residents logged 463.9 million person‑trips (one person on a trip away from home overnight in paid accommodations or on a day or overnight trip to places 50 miles or more away from home) for business purposes, with 38% for meetings and events (US Travel Association)
42% of people travel to visit friends/relatives, 8% for outdoor recreation purposes, 13% for entertainment/sightseeing, 15% for other pleasure/personal reasons, 3% for conventions/conferences/seminars, 7% for general business purposes and 4% for other reasons (US Travel Association)
81% of travelers consider it very important for brands to provide personalized experiences to their customers ( Travolution )
84% of Millennials and 73% of non-Millennials are likely or very likely to plan a trip based on someone else’s vacation photos or social media updates. ( APM Agency )
37% of Millennials have had their holiday destination influenced by social media and 34% have booked a holiday because of content seen on social media. ( WeSwap )
Leisure travelers ages 18–34 are 2.4x more likely than those ages 35 and over to discover travel destinations via mobile. ( Facebook )
89% of Millennials plan travel activities based on content posted by their peers online. ( Entrepreneur )
31% of Millennials said that posting holiday pics online is just as important as the holiday itself, and 29% wouldn’t choose a holiday destination if they were not able to post on social media while there. ( WeSwap )
42% of Millennials stress about taking the perfect photo for social media during vacation ( Value Penguin )
Top getaways travelers haven’t done before because they are too afraid, but would love to try include: volunteering trip (39%), gourmet adventure (38%), mystery trip (38%), sabbatical trip (36%), and an ancestry trip to find out about their heritage (36%) ( hospitalitynet )
51% of people travel to recharge their batteries when they feel stressed, busy, and tired (Intrepid Adventure Travel Index)
59% of solo travelers said the reason they travel alone is because they want to see more of the world and they’re not willing to wait for others (Solo Traveler)
45% of solo travelers like the freedom to do what they want when they want while traveling (Solo Traveler)
47% of millennials and 40% of generation Z travel to relax and avoid stress (WYSE Travel Confederation)
One in two (55%) travelers think the best thing about travel is getting out of their comfort zone (hospitalitynet)
One in five people plan to take health and well-being trips (Yoga and Meditation Retreats, Weight Loss and Fitness Retreats, etc.) in 2018, almost double the amount of people compared to 2017 (Booking.com)
95% of family travelers said their priority was keeping their families entertained and happy (Short Term Rentalz 2019)
89% of family travelers said their priority was deals and value of the vacation (Short Term Rentalz 2019)
85% of family travelers said their priority was planning travel around school holidays (Short Term Rentalz 2019
85% of families said their priority was being near major attractions or theme parks (Short Term Rentals 2019)
49% of families said their main priority when they take a family vacation is to visit new places and explore together, 42% to relax and unwind together, and 6% to be active and outdoors together (NYU)
45% of global travelers start their booking process by deciding on a specific destination (Trip Advisor)
77% of families said that “best value/price for our budget” was the most important factor when deciding where to stay on vacation (NYU)
28% of Millennials trust social media about travel providers over magazines, television and Google and TripAdvisor reviews. ( WeSwap )
25% of families had used a travel agent and 75% hadn’t for their family vacations in the past five years (NYU)
59% of families said travel websites (TripAdvisor, Expedia, etc.) were resources they used for information or inspirations for where to go and what to do, 10% said Instagram, 74% said search engines, 51% said travel review websites, 30% said social media, 12% said travel agents, and 8% said blogs (NYU)
58.2% of travelers used any user-generated content to help plan their leisure travel, 32.5% used reviews from hotel, 29.6% used travel reviews of destinations, 30.8% used reviews of restaurants or activities, 13.5% used travel itinerary or blogs, 33.3% used Facebook and 26.3% used group discount websites (Destination Analysts)
56% of solo travelers said the top factor they look for in a destination is safety (Travel Agent Central)
More than 40% of business trips in the past year have included a leisure portion added on (Expedia Media Solutions)
64% of Millennials prefer booking on travel websites for hotels, 47% prefer booking through specific hotel, resort and airline websites, and 24% prefer to book through travel agents (Resonance Consultancy)
79% of travelers who use a smartphone complete a booking after researching on their smartphones (Think With Google)

Travel Activities: What People Do When They Travel
- Half of leisure travelers are at least somewhat interested in taking a cruise in the next 12 months (MMGY)
- 41% of US travelers are seeking excitement/exhilaration on their next trip (Expedia)
- 11% of travelers are willing to try daring or high-adrenaline activities (Expedia)
- 24% of travelers are looking for an unforgettable night out (Expedia)
- 21% of travelers are most excited to try experiences they would usually never do, like: sleeping under the stars (19%), travelling alone (17%), skinny-dipping (11%) or having a vacation romance (10%) (Expedia)
- 61% of travelers are most interested in outdoor activities (like hiking, biking and kayaking) and wellness/relaxation experiences (Evolve)
- Travelers over 40 are more likely to travel with a significant other or multiple generations of family. Travelers under 40 are more likely to travel with a group of friends or solo (Evolve)
- When planning trips for 2022, US travelers feel that “new” is important: ( Trip Advisor )
- Seeing new places (75%)
- Having new experiences (71%)
- Going out to restaurants/trying new food (69%)
- Meeting new people (35%)
67% of high-income travelers said they would rather spend their vacation money on activities than a nicer hotel room ( Skift )
65% of travelers visited art/history museums, 59% aquariums, 56% science museums, 55% theme parks, and 55% zoos in 2017 (MMGY Global)
54% of travelers go shopping during their summer vacation, 49% visit historical sights, 49% go swimming or do water sports, 46% go to a park or national park, and 46% go on sightseeing tours (Statistic Brain)
21% of travelers who use social media for inspiration when researching trips are looking for info on attractions. ( WebFX )
Those who get tickets to watch athletic events while on vacation pay about $180 annually while those who play sports, like golf, while on vacation, spend about $640 per year ( Value Penguin )
Average entertainment costs, if incurred by vacationing households: $640 for participant sports, $541 for movies and other admissions, $180 for tickets to sporting events, $250 for other recreation expenses and $250 for other entertainment services ( Value Penguin )
Travel activities account for 8% of U.S. travel gross bookings and the segment comes in third by size behind hotels and flights (Phocuswright)
The U.S. travel activities market totaled $34 billion in 2018, and growth is outpacing the total travel market (Phocuswright)
More than three in four activities booked in-destination happened on the day of or day before the activity (Phocuswright)
Mobile searches for “things to do/activities” + “near me” have seen a 6X increase over the last two years. ( Think with Google )
Searches for activities are happening across devices in the three months prior to a trip, but shift significantly to 54% mobile when travelers are in-destination (Google)
35% of travelers have used mobile phones to book a tour or activity while already at a vacation destination ( Skift )
Travelers tend to book expensive activities more in advance compared to cheaper activities ( Tour Scanner )
85% of consumers use their phones to book travel activities, including restaurant reservations and sightseeing tours. ( MDG Advertising )

Other Travel Statistics
- US airlines are projecting 150% as many passengers to fly in 2022 as did in 2021 (IATA)
- 3.4 billion passengers are projected to fly in 2022, up from 2.3 billion in 2021, but still down from 4.5 billion in 2019 ( IATA )
- In 2022 overall demand for flights is expected to reach 61% of pre-crisis (2019) levels. Capacity is expected to continue to increase faster than demand, reaching 67% of pre-crisis levels for 2022 ( IATA )
- In 2022, demand for domestic flights is expected to reach 93% of pre-crisis (2019) levels ( IATA )
- In 2022, demand for international flights is expected to reach 44% of pre-crisis (2019) levels ( IATA )
- Air travel in January 2022 (measured in RPKs) was up 82.3% compared to January 2021, but down 4.9% compared to the previous month (December 2021) ( IATA )
- January 2022 domestic air travel was up 41.3% compared to January 2021, but down 7.2% compared to December 2021 ( IATA )
- January international air travel was up 165.6% compared to January 2021, but down 2.2% compared to December 2021 ( IATA )
- Hotel demand in January 2022 was 9% below 2021 levels ( US Travel )
- Nearly 1 in 6 job openings in the US are in leisure and hospitality ( US Travel )
- Overseas arrivals fell to 65% below 2019 levels in January 2022 ( US Travel )
- Leisure & hospitality accounts for 61% of all jobs still lost since 2020, and is recovering more slowly than the rest of the economy ( US Travel )
- Of the 10.9 million job openings in the US at the beginning of 2022, roughly one in six, or 1.7 million, were in leisure & hospitality alone ( US Travel )
- 58% of tourism professionals predict a travel rebound in 2022 (mostly in the third quarter) and 42% predict the rebound won’t happen until 2023 (UNWTO)
- 64% of tourism experts predict international arrivals will return to pre-pandemic levels in 2024 or later (UNWTO)
- 2020 was the worst year on record for tourism and 2021 the second worst year on record (UNWTO)
- US adults say travel brands should definitely take these precautions: ( Morning Consult )
- clean/sanitize common areas (71%)
- clean/sanitize private customer areas (70%)
- publicly share info about COVID-19 protocols (55%)
- allow for physical distancing (49%)
- require employees to wear masks (48%)
- require customers to wear masks (41%)
- use tech to minimize interactions (39%)
Most families own or lease the vehicles they use for road trips, but about 2% rent a car or truck on vacation and spend an average of $1,223 ( Value Penguin )
Despite their cultural prominence, only 0.5% of Americans travel via RV (recreational vehicle) ( Value Penguin )
Travel website cart abandonment rates are 81.6% which is higher than the overall average of 76.8%. ( SaleCycle )
Booking abandonment rates on hotel websites are 78.3%, with the most common reasons around research and price comparison ( IMPACT )
The U.S. travel market grew 5% in 2018, with gains remaining steady in 2019; by 2022, total gross bookings will have increased to $441 billion (Phocuswright)
90% of travelers now have apps to make their life easier when at their destination with maps, airlines, weather and social media (Travelport)
55% of global travelers report being more determined to make sustainable travel choices than they were a year ago (Booking.com)
73% of global travelers intend to stay at least once in an eco-friendly or green accommodation when looking at the year ahead (Booking.com)
70% of global travelers say they would be more likely to book an accommodation knowing it was eco-friendly, whether they were looking for a sustainable stay or not (Booking.com)
More than 60% of travelers would consider an impulse trip based on a good hotel or flight deal (Think With Google)
Plane and car are preferred modes of transport for family travel, with 52% selecting their mode of transport by the fastest option, and 34% based on lowest cost (Expedia Group)
The primary mode of transportation for domestic and international travel are: plane (66% domestic & 87% international), cruises (5% domestic & 35% international), train (6% domestic & 16% international), rental car (24% domestic & 14% international), personal car (60% domestic & 13% international), and buses (2% domestic & 10% international) (AARP)
Millennial’s are more likely to bring work with them on trips than Baby Boomers (78% versus 59%) (AARP)
51% of US travelers said that once they decided to go on a trip, they would spend less than one week researching flights (Facebook IQ)
Hotels and flights are booked in advance of 12 weeks and within the 3 months prior to the trip date (Google)
Gen Alpha (those born after 2010) is showing more signs of influencing family travel decisions and planning (Short Term Rentalz)
On average globally, travelers with Gen Alphas are taking more than three family trips a year (Expedia Group)
Online will account for the lion’s share of travel sales at 52%, with mobile sales representing a quarter of all travel bookings (Euromonitor International)
International arrivals are expected to amount o 1.8 billion trips by 2024, and domestic tourism is expected to reach 19 billion (Euromonitor International)
74% of consumers say experiencing things in the real world was a priority for them in 2019, with Baby Boomers being the most experiential and Gen Z being less so by 15% (Euromonitor International)
43% of global consumers say they prioritize experiences over things, while 78% value real world experiences in 2019 (Euromonitor International)
Got Travelers of Your Own?
We at Access Development know a thing or two about wholesale travel benefits and the white-label travel platforms used to increase member engagement. Contact us and learn about our private travel network for groups and organizations. Whether it’s deep discounts or cash-back travel rewards of up to 50% on hotel bookings, car rentals, theme park tickets and more, Access has the platform you need to offer your travelers unparalleled worldwide value.
Source https://www.condorferries.co.uk/us-tourism-travel-statistics
Source https://www.grunge.com/341123/what-it-was-really-like-for-native-americans-who-traveled-to-europe/
Source https://blog.accessdevelopment.com/tourism-and-travel-statistics-the-ultimate-collection