Where could I stay in Europe & travel to many Countries?

The most central country to stay in Europe and have access to the most popular countries, that don’t require a Visa, is France. It’s neighbored to the south by Spain and Portugal, to the north by Belgium and the Netherlands, to the northeast by Germany, to the east by Switzerland, Italy and the Mediterranean Sea and to the west by the Atlantic Ocean. The United Kingdom is also located to the west, but a Visa is required to enter, as it is not one of the Schegen Member States, like the other countries directly accessible from France. So if you are planning on visiting the UK, you will want to get your Visa well in advance of your departure time for Europe.
The rail runs to all countries surrounding France, so you won’t have to figure out how to get to another country. Buy a rail pass to save money, if you plan on visiting multiple countries over a period of 15 days or longer. Safety can be an issue on the trains during commuter runs, so beware of pickpockets and luggage thieves. If you like to travel by car or plane, then those are possibilities, although they may not be the quickest or most convenient way to get around.
All the countries surrounding France, and it included, are filled with the most beautiful historical sites, countryside, museums, castles, restaurants and cafes. They are home to some of the most cultured societies in the World. You will not be disappointed if you take time to visit every European country you can possibly fit in. Spain, Italy, France and Germany are the most popular countries to see, but be sure to take time to visit Switzerland, Belgium and the Netherlands for breathtaking natural beauty.
If you are planning a multi-country trip you’ll want to get travel insurance before you leave. Traveling a great deal can make you more prone to accidents and injuries, so getting travel medical insurance is a must for every foreign traveler. Being stuck in another country in the hospital and having to pay all your medical bills up front before you leave will cause financial and emotional stress if you aren’t covered by a good travel insurance policy. Another great way to cover yourself financially, when you are paying up front for an expensive flight and accommodations, is to get a trip cancellation policy. If you fall ill or have to cancel your trip because of another covered reason on the policy, then you won’t be out thousands of dollars and leave you only able to visit Europe in your dreams.
About Damian Tysdal
Damian Tysdal is the founder of TravelInsuranceReview, and he believes travel insurance should be easier to understand. See more from Damian on Google+.
Click below to find the right travel insurance, with the best coverage, at the lowest price
About this website

My name is Damian, and I started this website in 2006 to help travelers understand travel insurance.
The site features company reviews, guides, articles, and many blog posts to help you better understand travel insurance and pick the right plan for your trip (assuming you actually need travel insurance).
I am also a licensed travel insurance agent, and you can get a quote and purchase through this site as well.
Where Europeans Go For Summer Vacation
Summer is a classic time for travel. During the warm season, Americans flock to beaches, national parks and beyond. While we’re familiar with favorite American destinations like Florida and California, we wanted to know where Europeans like to go “on holiday.”
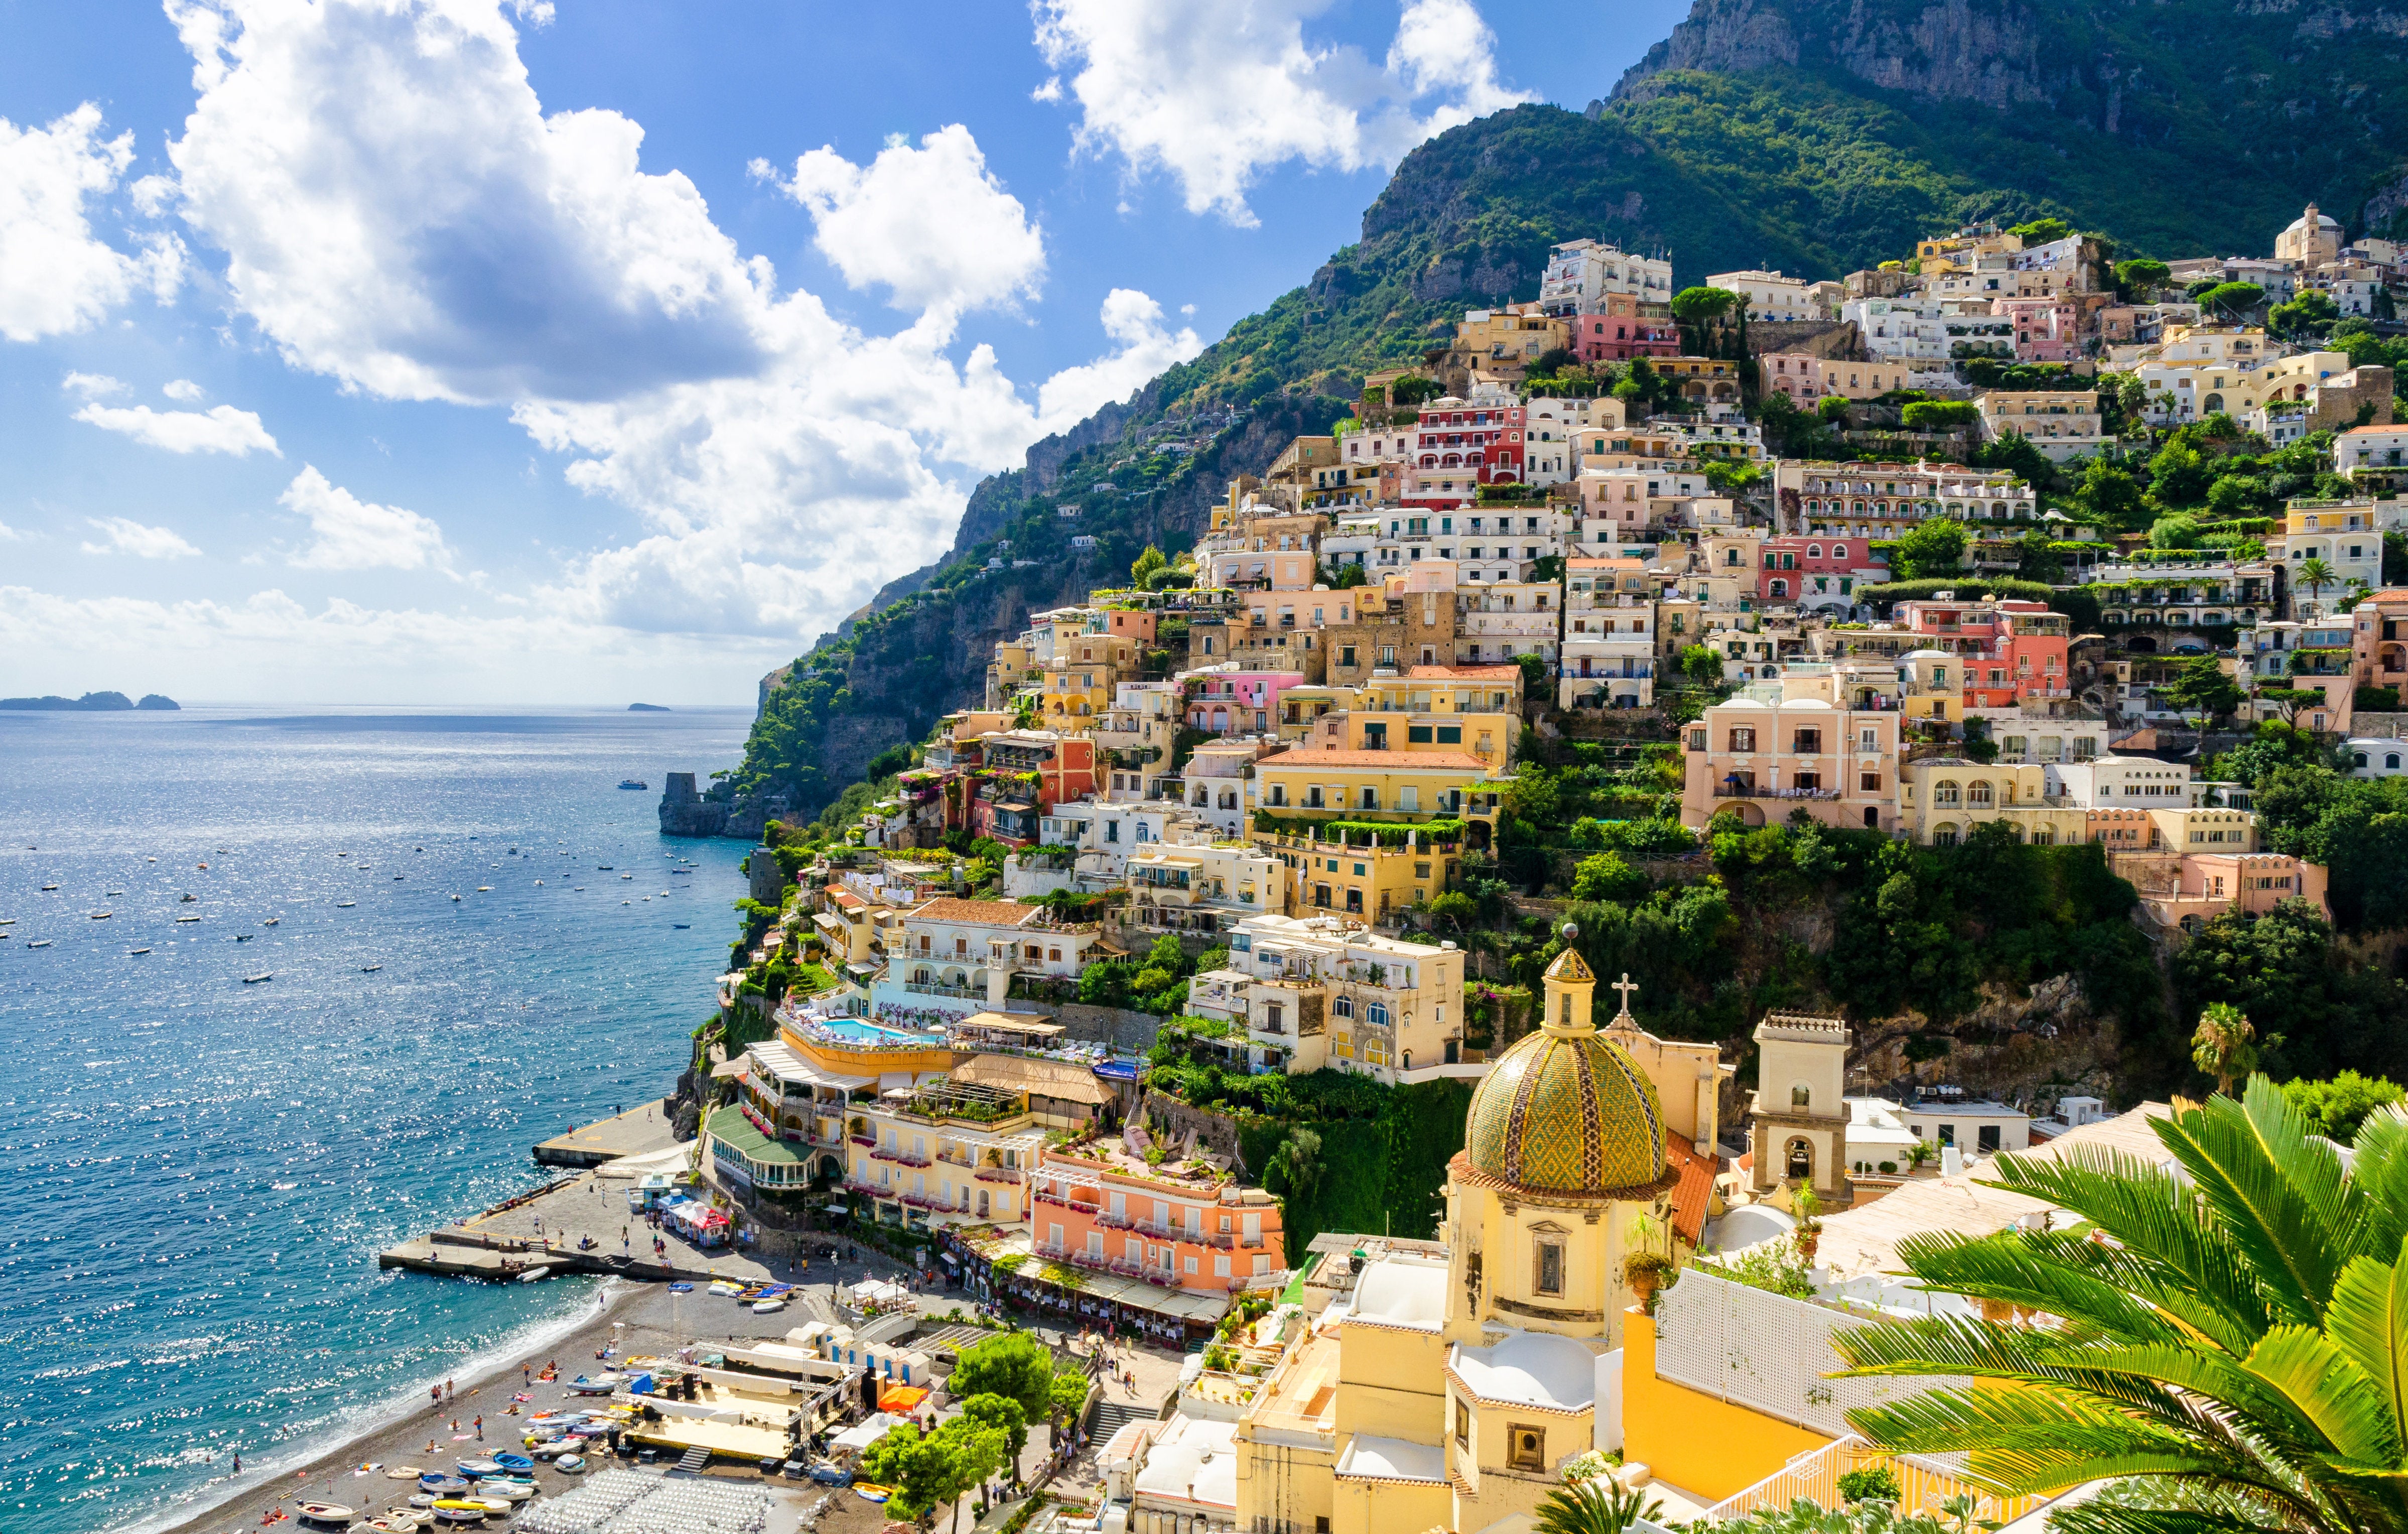
We asked travel bloggers from Europe to share their favorite summer travel spots, and the places where their fellow Europeans tend to congregate during the season. (Hint: It’s not too far from home.) Many locations, like the Amalfi Coast, are also popular with Americans ― while others, like the Bulgarian Black Sea, might be less familiar.
We’ve divided their answers into 15 destinations, though there is a bit of overlap. Without further ado, here are some travel spots sure to give you some serious wanderlust.
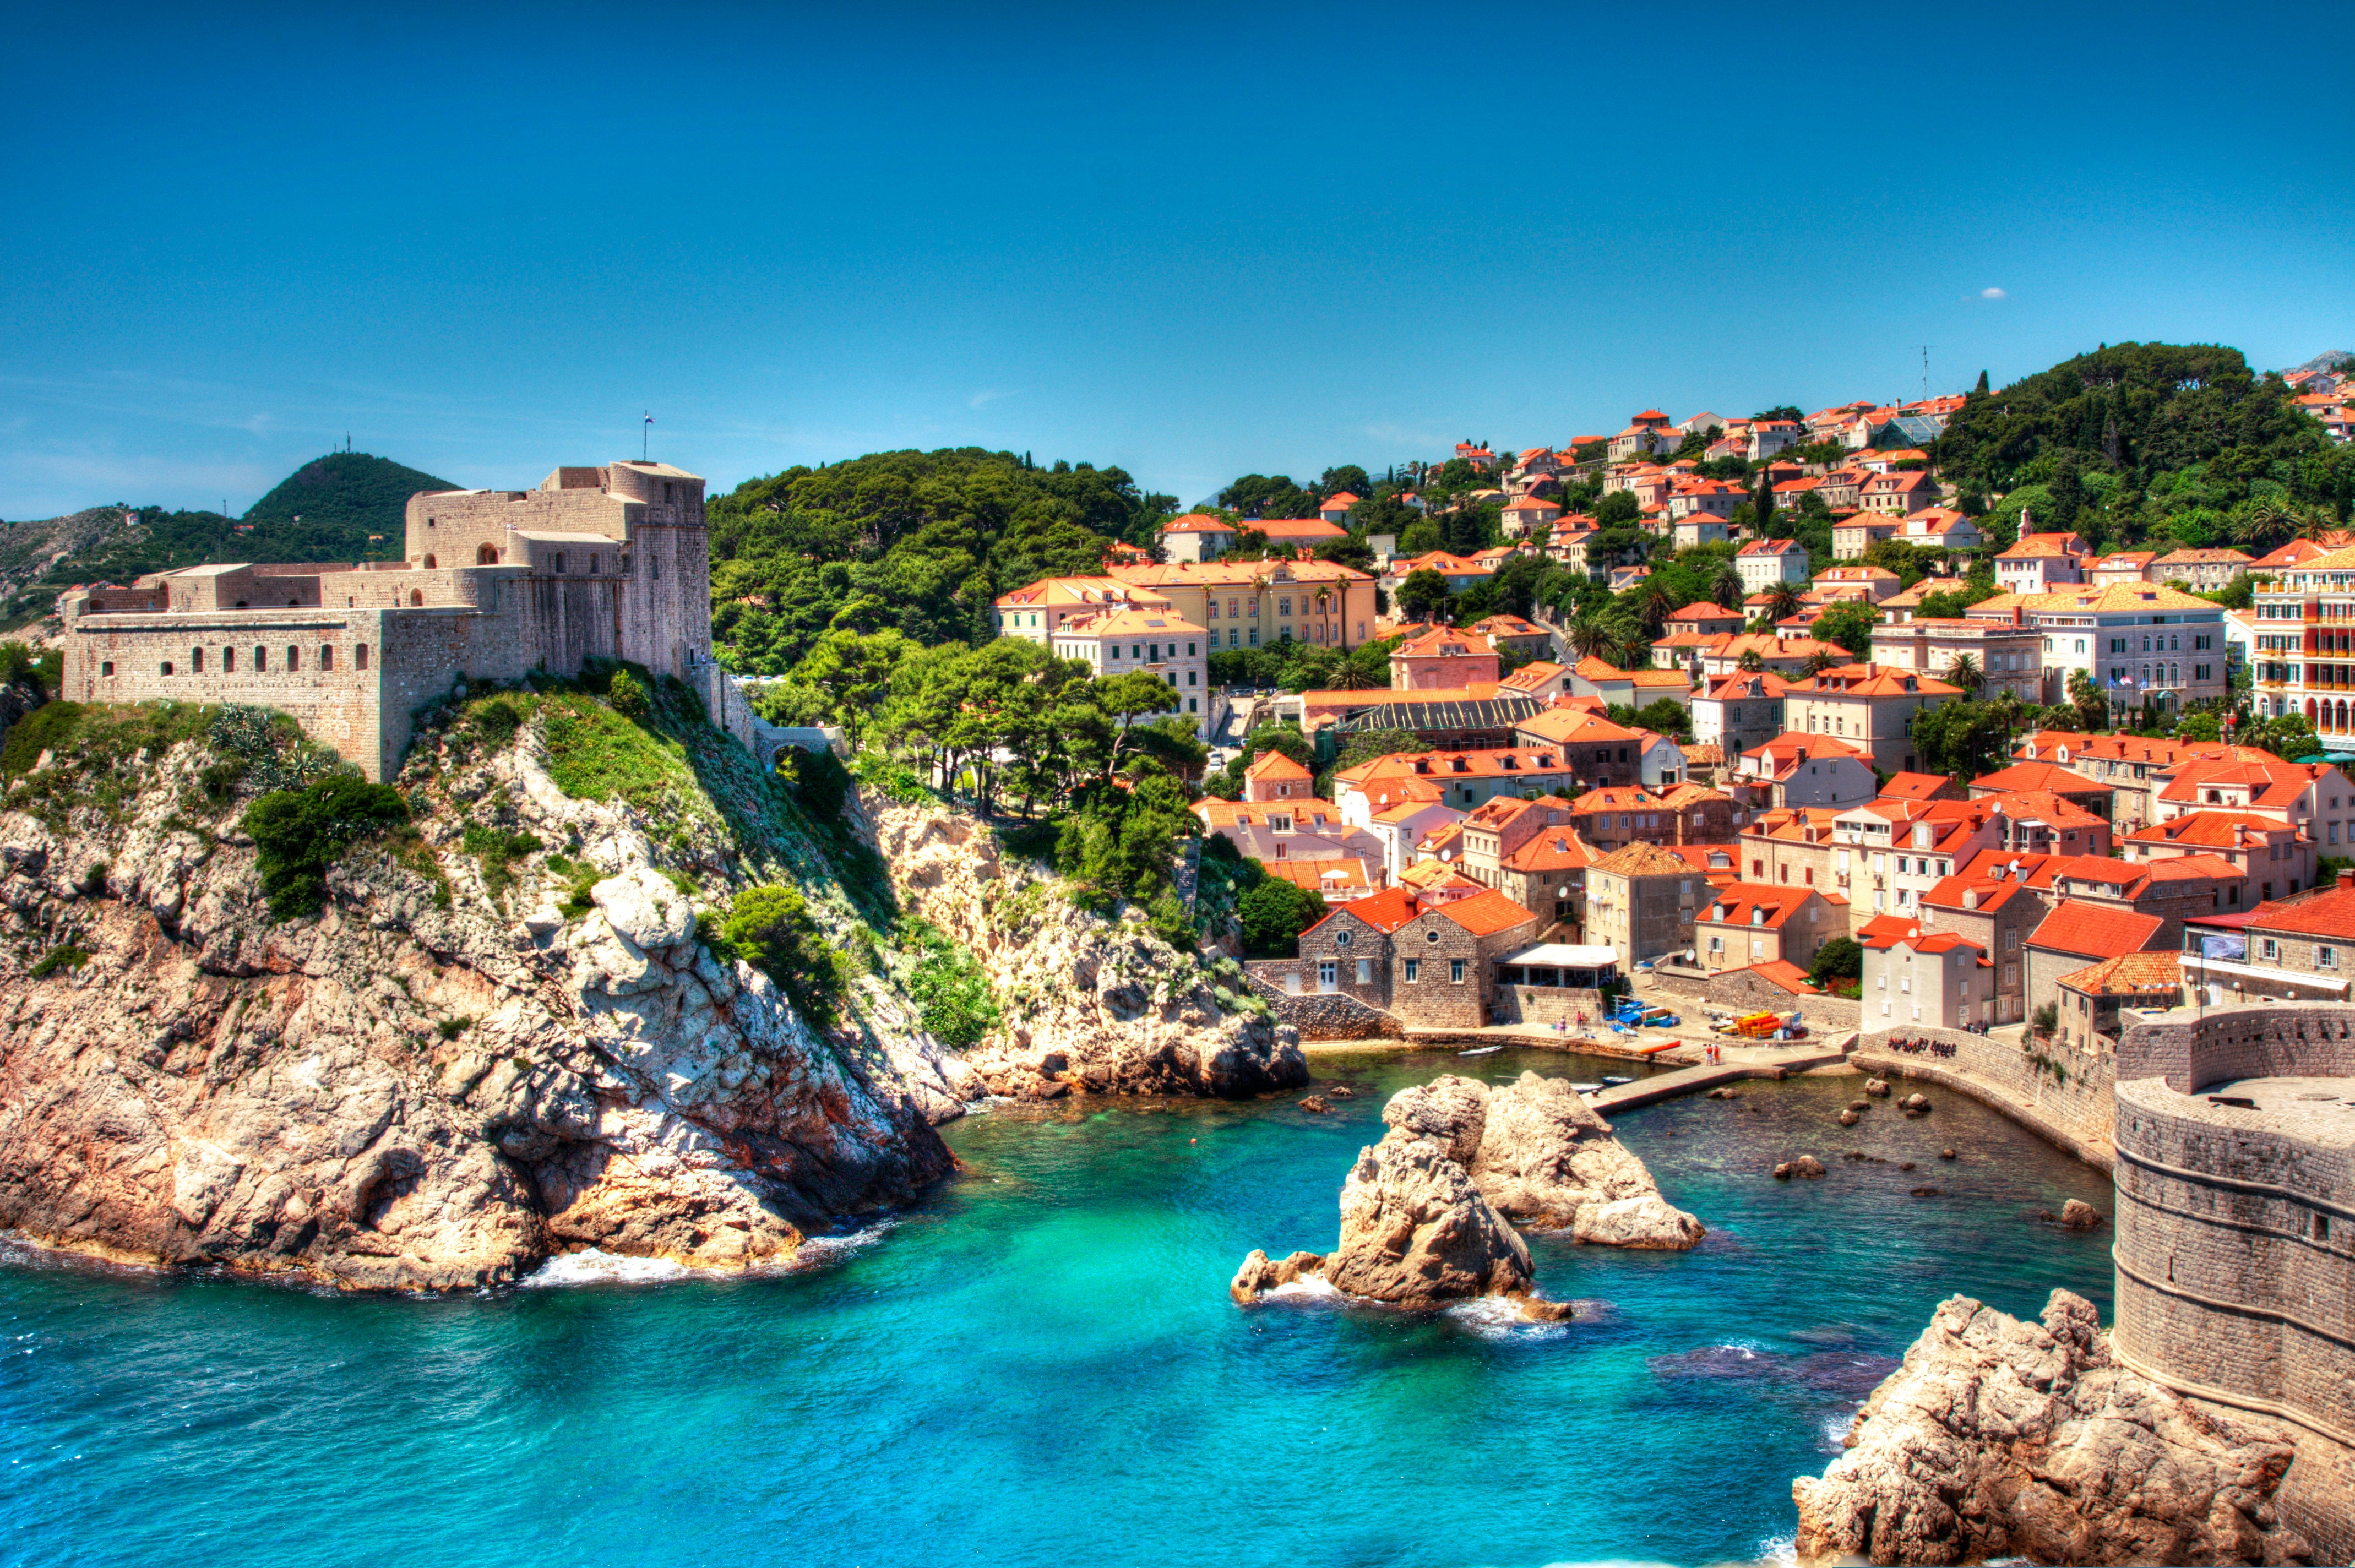
Croatia
“I think Croatia has become extremely popular over the last couple of years. I think a few factors caused the tourist boom. First, the popularity of ‘Game of Thrones’ ― fans want to see these gorgeous filming locations for themselves. Second, these days many Europeans are afraid of heading to Turkey, Egypt or Tunisia, previous hot spots for all-inclusive holiday packages. Croatia was an affordable alternative for beach holidays. Also, Croatia is a place that many Europeans can reach by car, so it’s very economical for families that can just hop in a car instead of paying for multiple plane tickets.” ― Anna Karsten, travel blogger at Anna Everywhere
Canary Islands
“Summer is all about great weather and interesting adventures. As I love being active while enjoying the sun, one of my favorite summer destinations is Fuerteventura, one of the Canary Islands of Spain. It offers a great combination of surfing opportunities and spectacular scenery. Fuerteventura is easily reachable from Spain and all over Europe. A boat ride to the nearby island Los Lobos is a perfect day trip, as are the other Canary Islands such as the more popular Gran Canaria and Tenerife.” ― Maria Stoyanova, travel blogger at Travelling Buzz
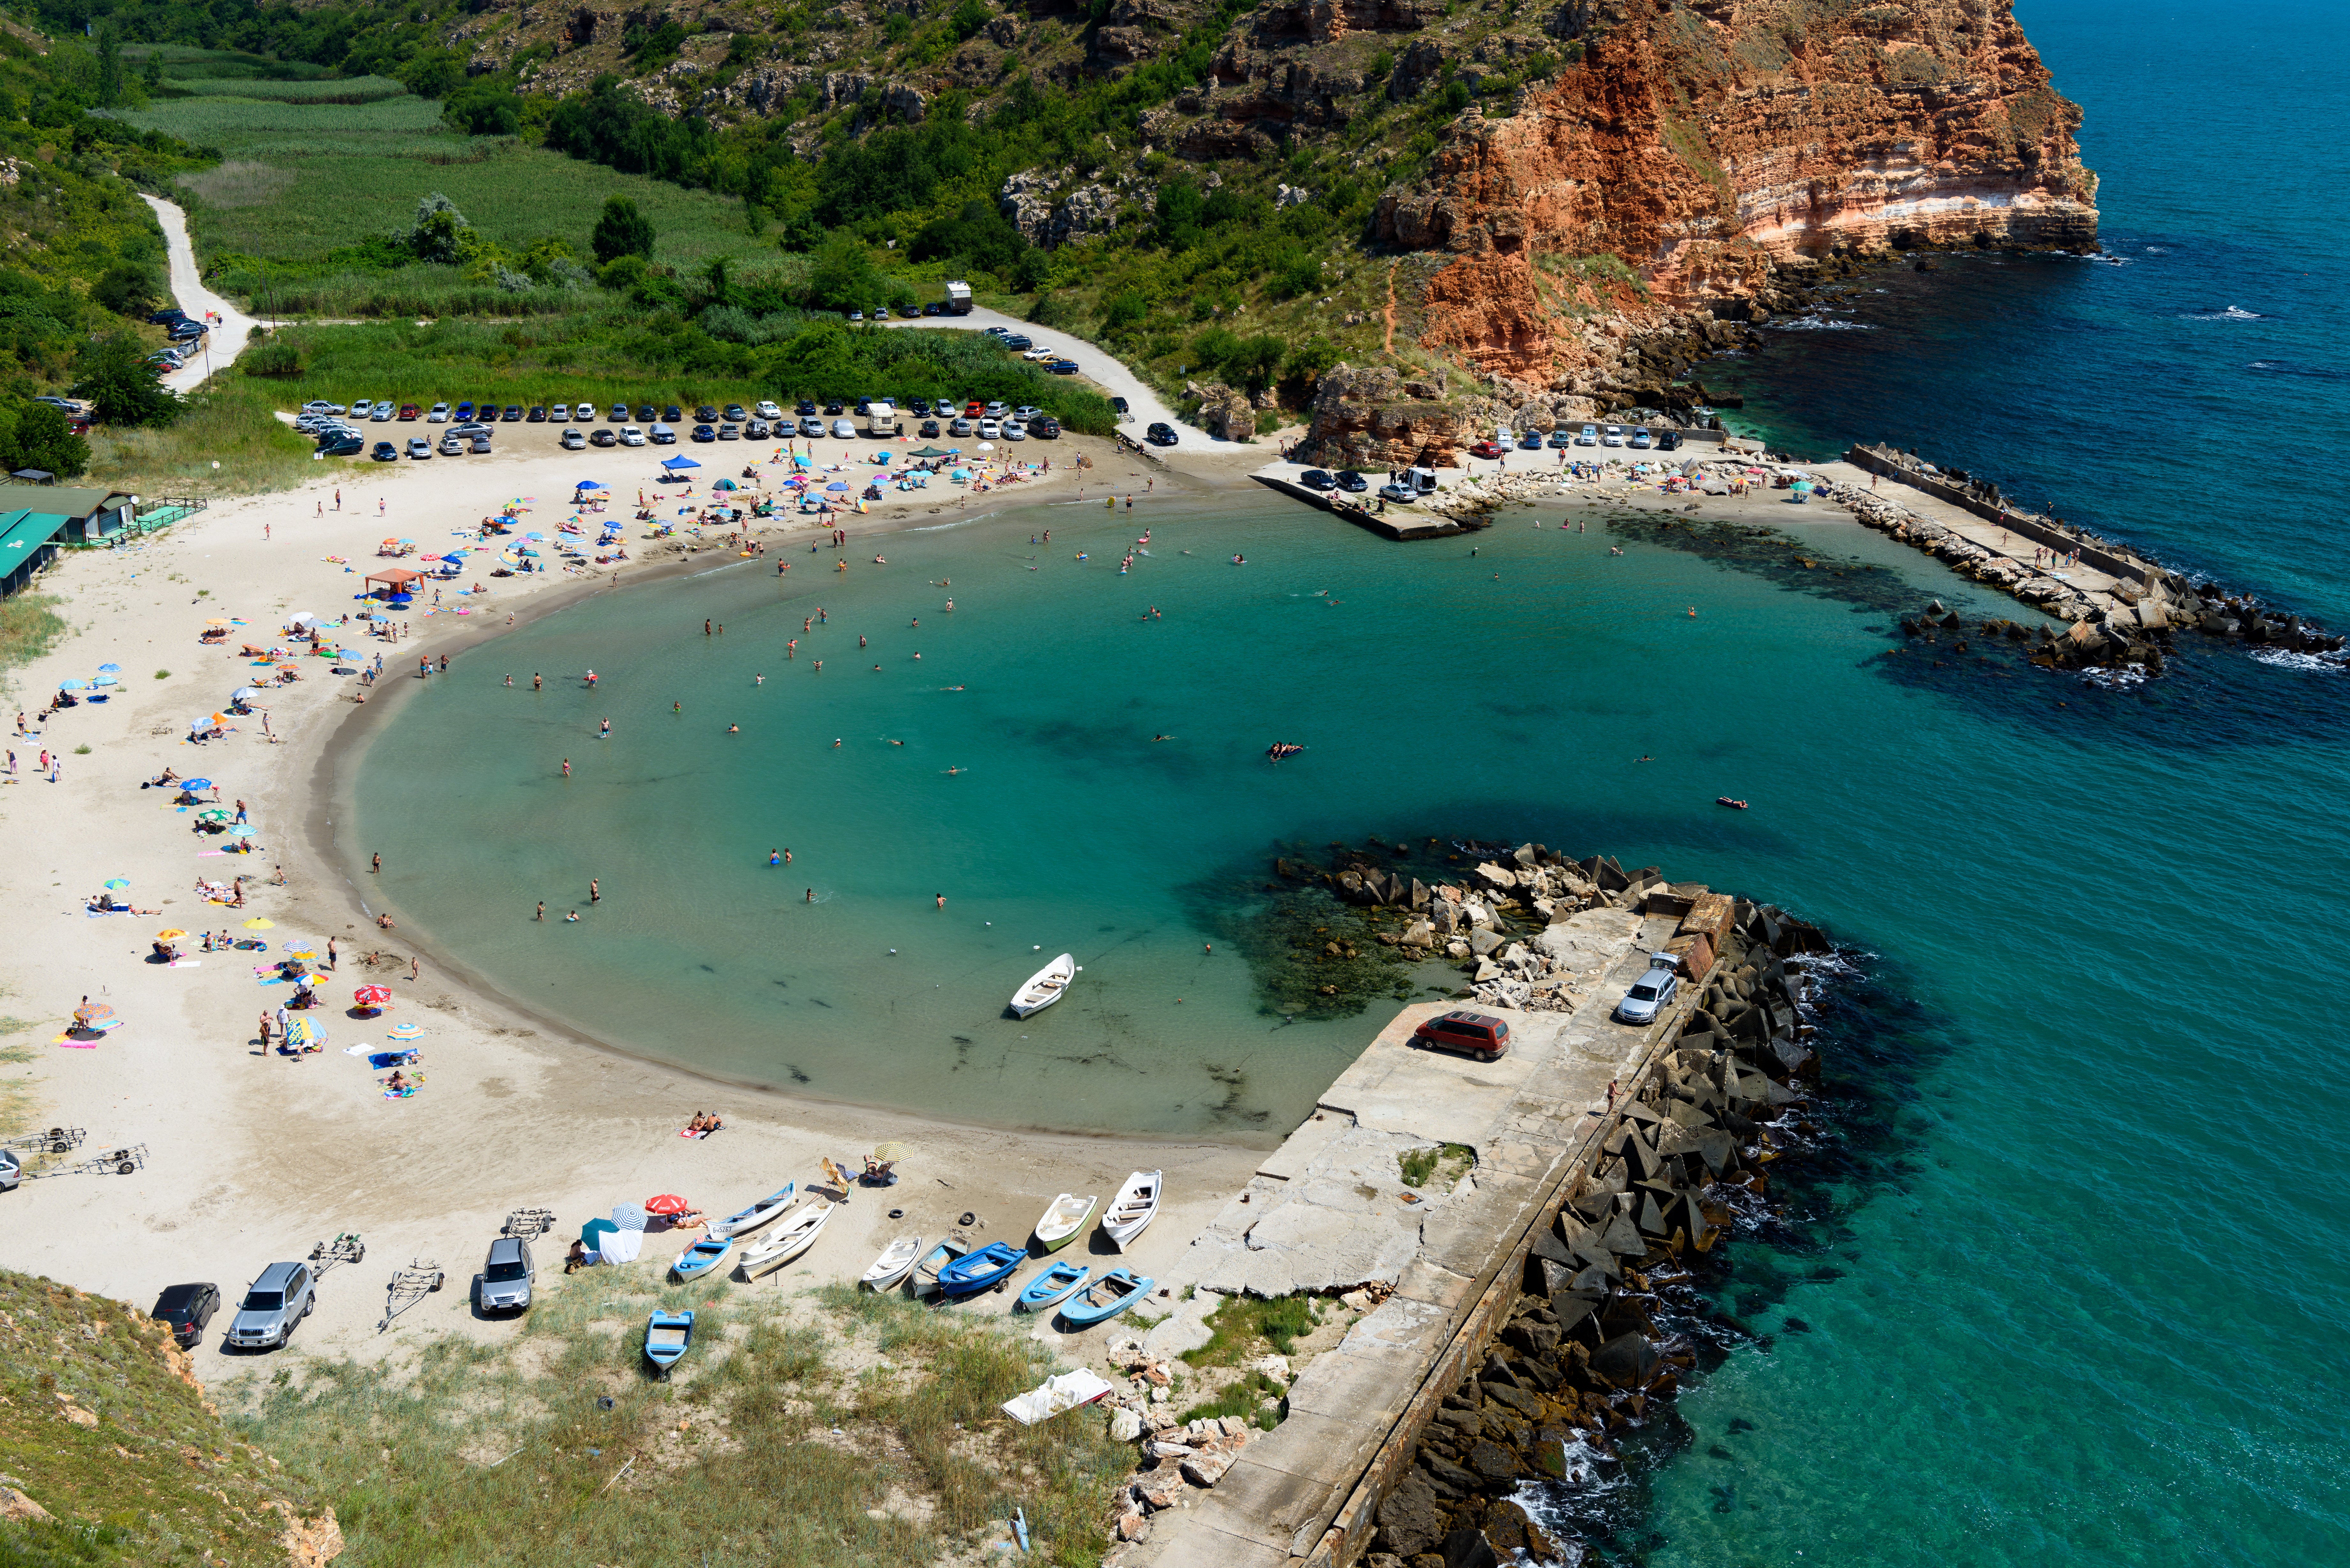
Bulgarian Black Sea
“The Bulgarian Black Sea Coast has always been a popular destination among Europeans for summer holidays. The picturesque Sozopol, the UNESCO World Heritage town of Nessebar, the long sandy beaches of Gradina and Smokinya make it a great place for vacation with kids or friends. All of this, added to the affordable prices, great food and quality, attracts people from all over Europe.”
― Stoyanova
Greek Islands
“My favorite places to travel during the summer are the Greek Islands. Greece has more than 6,000 islands, of which about 230 are inhabited. There is an island for every taste. You can find pebbled beaches or sandy beaches, green islands or not, the most amazing colors in the water, nightlife, rich history, great food, hospitable people and fantastic weather. Alternatively, I would choose an island in Italy like Sardinia. The Mediterranean is the best place to spend your summer. I have noticed that a lot of Europeans tend to visit some specific places in the summer more than others. For example Santorini, Zante, Rhodes in Greece or Southern Spain, the Canary Islands, etc.” ― Chrissy Manika, tourism professional and travel blogger at Travel Passionate
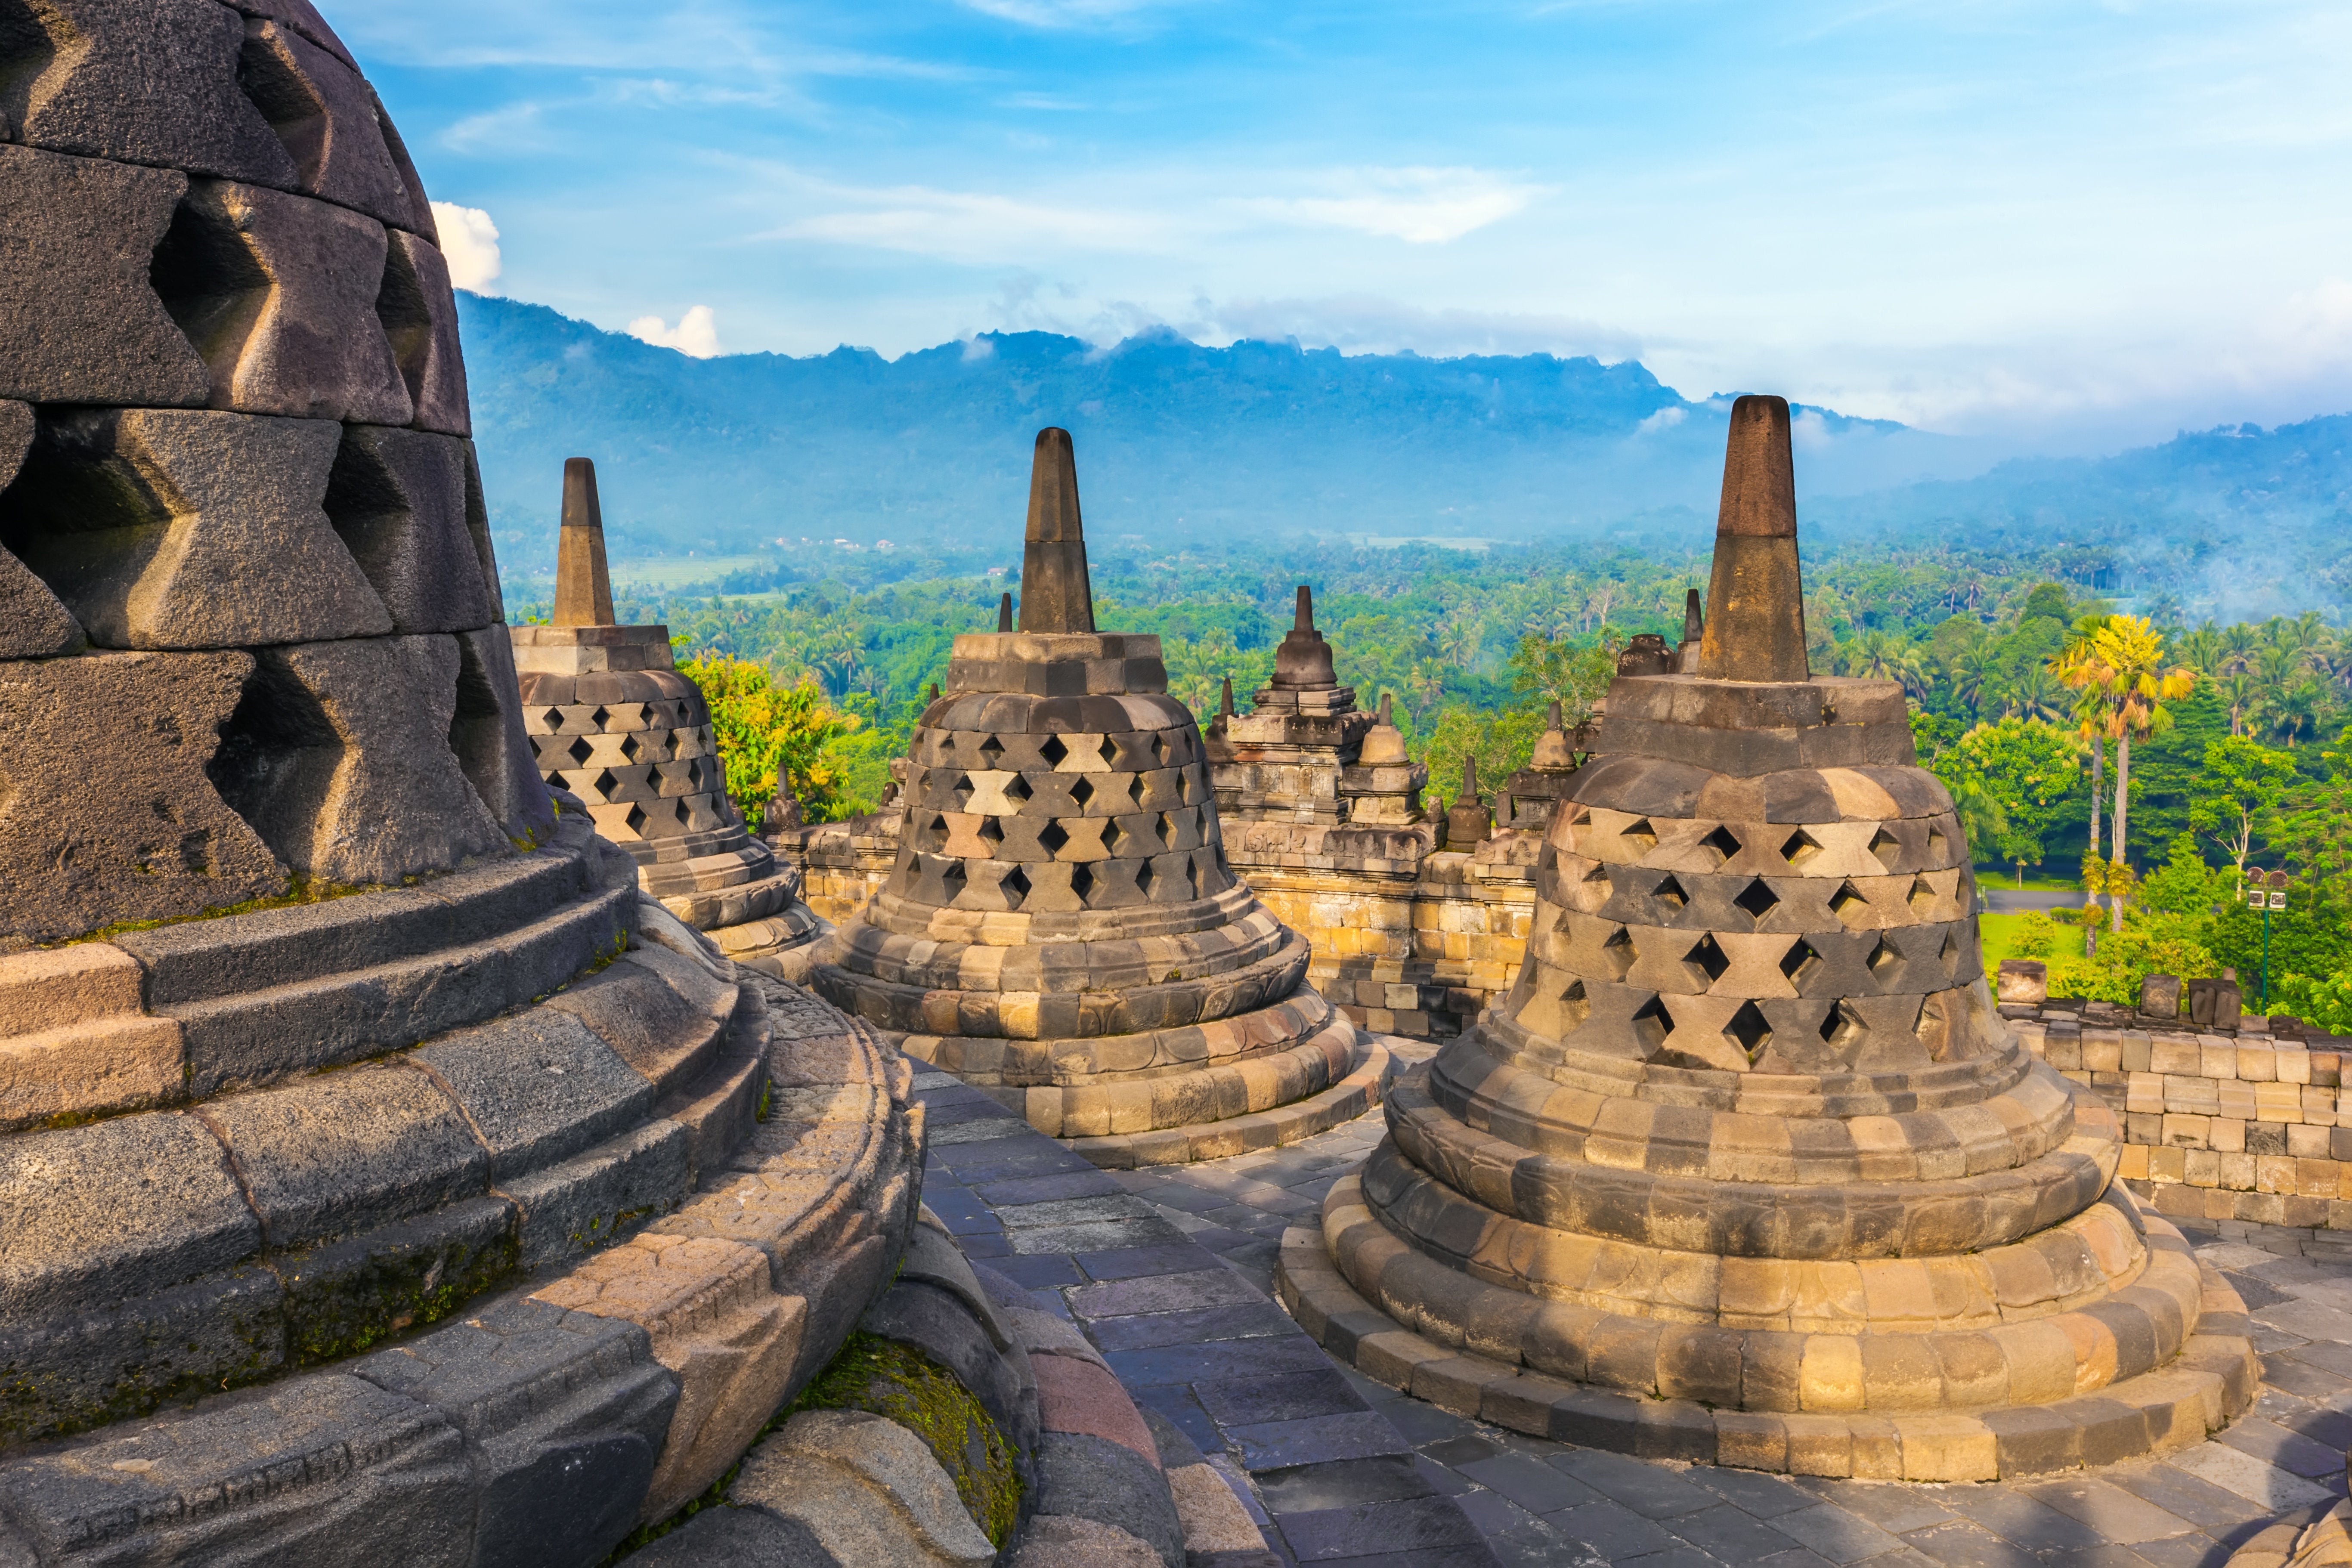
Indonesia
“Indonesia is very popular. Loads of Europeans like to explore a completely different climate and culture. The flights are long so the best period to go is during summer holidays when most people can go on a long holiday of work.” ― Nick & Hannah, travel bloggers at Salt in Our Hair
“One of my favorite places I had the chance to go to recently was Sulawesi, an island of Indonesia. Sulawesi is still very authentic and cheap with few tourists. You can enjoy the stunning Toraja culture, discover some very rare animals species in their tropical forest (tarsier, birds, monkeys) or swim into one of the most preserved and colorful coral reefs in the world.” ― Alex Vizeo, travel blogger and YouTube personality
“Abroad, Southeast Asia is the biggest tourist attraction, since it’s cheap, it has many inexpensive flights compared to other regions in the world, and the culture is very different to ours! It’s easy to travel there and safe for every type of traveler. Of course, avid travelers take on more exotic destinations, but it’s not the norm.” ― Alvaro Rojas, travel blogger at Wander Reds
Sweden
“During July, I do actually prefer to stay in Sweden. There are few things that beat a good Swedish summer. And the best place to go is the Swedish island called Gotland. My favorite place all year around is Italy ― the ultimate mix of great food, sun, culture, beautiful language and a perfect cappuccino in every corner.” ―Sofia Zetterqvist, writer and travel blogger at Fantasiresor
Spain
“I’m based in Barcelona and have seen tourist numbers skyrocket over the last few years. I think people come to Barcelona because it’s such a dynamic destination. From the labyrinthine alleyways of the Gothic Quarter to the iconic Picasso Museum, there’s a wealth of cultural and historical attractions to explore, not to mention Antoni Gaudi’s colourful architectural marvels and the city’s world-class gastronomy scene. But as well as offering the best of a city break-style holiday, Barcelona also boasts a 4-5 kilometer stretch of urban beaches, which are blessed with the region’s Mediterranean climate and a clutch of trendy nightlife options. Other popular destinations in Spain include places like Madrid, Valencia and Seville, although I’m excited to see more people heading north to the greener and less-touristy Spanish regions of Galicia, Asturias, Cantabria and the Basque Country, all of which offer unique cultural charms, world-glass gastronomy and some of the most outstanding natural beauty in Europe. Spain’s Balearic Islands (Mallorca, Menorca, Ibiza) are also extremely popular for those in search of a more beachy type of holiday ― they’re well set up for families as well.” ― Ben Holbrook, photographer and travel writer at Driftwood Journals
“Spain is quite popular. I am in love with Barcelona, like many others. Some people don’t mind the crowds so they go in peak season. I think the most important thing is affordability, great food and nice beaches and shopping. I mean, who doesn’t want a good sangria with some ham croquettes on a sandy beach in Barcelona? One other thing is affordable flights. For example, coming to Croatia is a very expensive sport, but Spain has so many low cost airlines flying in and out all year around. People want to relax on their holidays, not be stressed thinking about their wallets, so I think that is why Spain is so popular.” ― Ella Dvornik, lifestyle and travel blogger at I Am Ella
Travel and Tourism Statistics: The Ultimate Collection
What did Mr. Bradbury mean when he penned this now famous quote? We may never know.
Don’t get the wrong idea, of course. We get the part about travel being extra rewarding when people get far off the beaten path into places they didn’t even know existed. (Duh.)
What civilization will always wonder is this. Did he mean “half” in the general sense, as in give or take a third? Or “half” in the 50% sense, where if he’d meant 51 percent, he’d have said 51 percent?
Whatever the math behind Ray’s statistical calculations, one thing we know for sure…
People looooooove to travel.
Families and individuals of all ages, sizes and incomes. To faraway lands. For weekend getaways. To pursue new business deals. With kids. Without kids. On planes, trains, automobiles, boats and buses.

And when it comes to the best corporate discount programs, association member benefits, white-label rewards programs, and membership perks in general, discounted travel is often among the most hotly pursued additions to the mix. Why?
Because our hard-earned PTO is usually spent on travel. Because lots of money AND emotional expectation are wrapped up in most of our travel purchase decisions.
So to better understand today’s traveler, we at Access have compiled what we believe is a comprehensive “ultimate collection” of statistics having to do with the travel and tourism industry. We’ve tried to make this list as relevant as possible, which means we combed through recent research from travel and tourism related sources.
Most of these stats are focused on Americans who travel – though other nationalities may creep into the mix from time to time. We’ve provided source links for each statistic. Sometimes you’ll find the data conflicts with other sources – so we’ll leave it up to you to decipher which is most accurate.
We’ll keep this list updated regularly with the latest and greatest. If you know of a stat we’re missing, or want your own research included in our collection, leave us a note in the comments. Enjoy!

Travel Costs: How Much People Spend
- Americans are more willing to splurge on travel plans in 2022: 15% will upgrade rooms or flights, 16% will visit bucket-list destinations, 32% will splurge on the things that take a trip from good to great (Expedia)
- Travelers age 18-34 are the most likely to go big on their next trip (80% compared to 56% of travelers over 50) (Expedia)
- Gen X travelers are the most likely to splurge on a high-end restaurant (18%, compared to 16% overall) (Expedia)
- In 2021, premium economy ticket prices were around 290% more expensive than economy tickets, compared to pre-pandemic when they were 430% more expensive (Expedia)
- 68% of Americans are planning to go big on their next trip (Expedia)
- 40% of US travelers are more willing than ever to splurge on their future travels (Expedia)
- Global travel and tourism levels are projected to reach pre-pandemic levels in 2022, contributing nearly $2 trillion to the US economy (WTTC)
- U.S. domestic travel & tourism spending is forecast to reach more than $1.1 trillion for the year, surpassing pre-pandemic levels by 11.3% (WTTC)
- International traveler spending in the U.S. could reach $155 billion which is a growth of $113 billion, compared to 2020, though it would still be slightly below (14%) 2019 levels (WTTC)
- Employment travel and tourism could surpass pre-pandemic levels, reaching nearly 16.8 million jobs, which is above pre-pandemic levels by almost 200,000 jobs (WTTC)
- Airline losses from 2020-2022 could reach $200 billion (IATA)
- After reducing costs in 2021 by 34%, expenses are expected to rise again in 2022 due to expanded operations and higher fuel prices, averaging only 15% lower than pre-pandemic levels ( IATA )
- Boomers plan to spend the most of any generation: at least $4,000 on travel in the next 12 months (MMGY)
- With the rising price of fuel, domestic flight prices rose 36% in March 2022 from the beginning of the year to reach an average price of $300 (Bloomberg)
- The 2022 travel price index rose 12%, mostly driven by a 44% increase in motor oil ( US Travel )
- The January 2022 travel price index was 11.6% higher than 2019 levels (on par with consumer prices overall) ( US Travel )
- In January 2022, travel spending declined to $79 billion, this is down from $92 billion in December and down 11% from January 2019 levels ( US Travel )
- 50% of travelers would not pay extra for plane fare that offers free cancellation, 17% would pay up to $20 more, 16% would pay $20-$49 more and 9% would pay $50-$99 more ( Morning Consult )
- 56% of travelers would not pay extra for plane fare from a company that prioritizes pandemic safety, 17% would pay up to $20 more, 13% would pay $20-$49 more and 9% would pay $50-$99 more ( Morning Consult )
- 51% of Americans who traveled in the spring of 2021 plan to spend more when they travel in 2022, 23% plan to spend significantly more (Trip Advisor)
- Average spend per booking for US travelers in spring 2022 is up 87% year-over-year (Trip Advisor)
- American travelers are spending 29% more on their average booking in 2022 than they did in 2019, this is despite staying an average of 3.7 days, down from 4.4 days in 2019 ( Trip Advisor )
- The economic contribution of global tourism in 2021 is estimated at $1.9 trillion, above the $1.6 trillion in 2020, but still below the $3.5 trillion in 2019 (UNWTO)
- Global tourism spending is estimated to be $1,500 per trip in 2021, up from $1,300 in 2020 (UNWTO)
- In 2020, international travelers spent $83 billion compared to $233 billion in 2019, a loss of 64% (US Travel )
- In 2020, International travelers spent money on US goods and services (US Travel):
- Travel spending – $38.1 billion (compared to $139 billion in 2019)
- Passenger fares – $26.5 billion (compared to $40.1 billion in 2019)
- Education-related – $37.4 billion (compared to $44 billion in 2019)
- Health-related – $0.2 billion (compared to $1.2 billion in 2019)
- Border/seasonal workers – $7.6 billion (compared to $9.1 billion in 2019)
- US travel spending in 2020 totaled $680.3 billion ($642.2 billion domestic travel spending and $38.1 billion international spending) (US Travel)
- US travel spending in 2019 totaled $1,172.6 billion ($993.5 billion domestic travel spending and $179.1 billion international spending) (US Travel)
- In 2019 traveler spending totaled $1.1 trillion: $278.9B for food services, $242.3B for lodging, $210.8B for public transportation, $169.7B for auto transportation, $117.8B for recreation/amusement and $107.3B for retail ( US Travel Association )
Direct spending on leisure travel by domestic and international travelers totaled $792.4 billion in 2019 ( US Travel Association )
Direct spending on business travel by domestic and international travelers totaled $334.2 billion in 2019 ( US Travel Association )
In 2019, domestic travel spending grew 4.4% (for leisure grew 5.1%, for business grew 2.8%) ( US Travel Association )
Domestic travel expenditures industry breakdown for 2019 were: food services 25%, public transportation 20%, lodging 20%, auto transportation 17%, recreation/amusement 11%, retail 7% ( US Travel Association )
On average, Americans plan to spend $737 on their upcoming trip. Gen Xers will spend more than other age groups, and parents of kids under 18 plan to shell out more than $1,000 ( Value Penguin )
The average expense for a 4-night domestic vacation is $581 (or $144 per day): $224 for transportation, $150 for lodging, $155 for food/alcohol and $52 for entertainment ( Value Penguin )
The average expense for a 12-night international trip is $3,251 (or $271 per day): $1,755 for transportation, $683 for lodging, $520 for food/alcohol and $293 or entertainment ( Value Penguin )
Americans spend an average of $33 per day on food when on a domestic vacation, about 80% of which is spent in restaurants ( Value Penguin )
Americans spend an average of $35 per day on food when on an international vacation, about 90% of which is spent in restaurants ( Value Penguin )
2.7% of the nation’s gross domestic product (GDP) attributed to travel and tourism (US Travel Association)
Vacationing millennials (ages 18-34) spent, on average, $1,373 on summer vacations (Allianz Travel Insurance)
On average, Americans in the South spent less on vacationing ($564 on domestic and $3,169 on international) compared to the Northeast, Midwest, and West (Reward Expert)
Baby Boomers expect to take 4-5 leisure trips next year, spending up to $6,395 on travel expenses – the same or more than they spend in 2017 (AARP)
26% of American domestic travel expenses go towards food services, 20% towards public transportation, 20% towards lodging, 17% towards auto transportation, 10% towards recreation/amusement and 7% towards retail (US Travel Association)
Travelers who book their activities ahead of their trip spend 47% more on lodging than those who wait to book (Booking.com)
Lodging costs are about 26% of total travel expenditures for domestic trips, and 21% for international trips (Value Penguin)
On average, excluding airfare, 30% travelers aged 55-64 spend $1500-$2500 on a one-week trip (Solo Traveler)
Food plus alcohol take up about 16% of the budget for an American’s international trips, and about 27% of their domestic trips (Value Penguin)
Transportation costs make up 54.3% of international trip expenditures and 39.1% on domestic trips (Reward Expert)
More than 25% of travel costs go toward food for domestic travel and 16.2% for international travel (Reward Expert)
37% of travelers are very likely to splurge on food and drink experiences (WYSE Travel Confederation)
4% of travelers are likely to splurge on first or business class air fare (WYSE Travel Confederation)
The typical vacationing U.S. family spends about 44% of their travel funds getting to, from, and around their destinations (Value Penguin)
Travelers who book their activities ahead of their trip spend 81% more on transportation than those who wait to book their destination (Booking.com)
65.3% of Americans say that leisure travel is somewhat of a budget priority for them (Destiantion Analysts)
83% of families will splurge on their travel destination when planning a vacation, 68% on paid attractions, 68% on staying close to their destination, 63% on eating out/food and 63% on the length of their trip (NYU)
24% of solo travelers spend more than $1,500 for one week of vacation (excluding airfare) (Solo Traveler World)
Each overseas traveler spends approximately $4,200 when they visit the U.S. and stays on average 18 nights ( US Travel Association )
Flying coach instead of business saved business travelers $2,975 on average per round-trip flight (Rocketrip)
42% of Americans paid lodging costs for domestic travel vs. 60% for international travel, as domestic travelers often stay with family and friends ( Value Penguin )
Taking an early-bird flight saved business travelers $66 on average per round-trip flight (Rocketrip)
Managers saved an average of 15% per trip, $572 per year and took an average of 5 trips per year (Rocketrip)
Directors saved an average of 12% per trip, $684 per year and took an average of 6 trips per year (Rocketrip)
Vice Presidents saved an average of 11% per trip, $651 per year and took an average of 6 trips per year (Rocketrip)
CXOs saved an average of 9% per trip, $1,081 per year, and took an average of 8 trips per year (Rocketrip)
26% of Americans will use their rewards points or miles to fund their next vacation ( Value Penguin )
Vacation spending is equal to about 2% of the total budgets of all U.S. households annually ( Value Penguin )

Traveler Demographics: A Profile of People Who Travel
- Of travelers who subscribe to travel related paid subscriptions, 62% are male and 38% are female ( Trip Advisor )
- Of American travelers who subscribe to a travel related paid subscription program, 11% are between the ages of 18-24, 26% are 25-34, 22% are 35-44 and 25% are 55+ ( Trip Advisor )
- Millennials are planning to take the most trips of any generation: an average of 4.4 trips in the next 12 months (MMGY)
- 52% of active leisure travelers are members of at least one hotel loyalty program, and 48% have joined at least one airline loyalty program (MMGY)
- Millennials are 11-percentage-points more likely to stay at a chain hotel than the general population ( Morning Consult )
- Travelers with an income of less than $50,000 are the least likely to say price is a top priority ( Morning Consult )
- 42% of US Adults who took more than 3 business trips per year pre-pandemic expect to never travel for business again, 14% expect to take a business trip after more than a year, 10% within 7-12 months, 13% within 4-6 months, 13% within 1-3 months and 7% in less than a month ( Morning Consult )
- More employed travelers anticipate taking a blended trip (combining business and leisure travel) in the next year: 40% with an even split between business and leisure, 40% blended primarily business and 44% blended primarily leisure. 41% of travelers anticipate taking a business only trip this year and 76% taking a leisure only trip ( Morning Consult )
- Millennials are the most likely to stay at a hotel in the next 3 months at 39%, followed by boomers (28%), Gen X (23%) and Gen Z (9%) ( Morning Consult )
- 75% of travelers who plan to stay in a hotel in the spring of 2022 are vaccinated and 16% are unvaccinated ( Morning Consult )
- 6% of all US adults will stay in a vacation rental in the next 3 months ( Morning Consult )
- 20% of travelers with travel plans in the next 3 months expect to stay in a vacation rental ( Morning Consult )
- Millennials are the most likely to stay in a vacation rental at 46%, followed by Gen X (17%), boomers (16%) and Gen Z (21%) ( Morning Consult )
- US adults who have imminent travel plans are more likely to want precautions from travel brands ( Morning Consult )
- Travelers predict they will next travel for leisure in 1 month (11%), 1-3 months (22%), 4-6 months (22%), 7-12 months (13%), in more than a year (19%) and never (12%) ( Morning Consult )
- Travelers of all demographics are more comfortable traveling now than they were during the height of the Omicron outbreak, with high income earners and previous travelers reporting feeling the most comfortable ( Morning Consult )
- In March 2022, more than half of US adults said they would travel for leisure in the next 6 months, up 6 percentage points from January 2022 ( Morning Consult )
- Travelers who traveled 3 or more times a year before the pandemic (who are likely to be millennials and high income earners) are the most likely to be planning a trip soon ( Morning Consult )
- While travelers in the US and many European countries are more confident about taking a leisure trip in the next 6 months, many East Asian travelers are less confident. For example, from October 2021 to March 2022: ( Morning Consult )
- US travelers saw a 5-percentage-point increase in confidence (from 50% to 55%)
- German travelers saw a 17-percentage-point increase in confidence (from 46% to 63%)
- UK travelers saw a 13-percentage-point increase in confidence (from 44% to 57%)
- China travelers saw a 10-percentage-point decrease in confidence (from 47% to 37%)
- Japan travelers saw a 6-percentage-point decrease in confidence (from 33%) to 27%)

Travel Destinations: Where People Go When They Travel
- The top 3 destinations for outdoor enthusiasts because of national parks and natural wonders are: 1. Arenal Volcano National Park, Costa Rica 2. Jim Corbett National Park, India and 3. Serengeti National Park, Tanzania. The top US destination for outdoor enthusiasts is Denali National Park and Preserve, Alaska (TripAdvisor)
- The top 3 destinations for food lovers because of restaurants and restaurants and foodie experiences are: 1. Rome, Italy 2. London, UK and 3. Paris, France. The top US destination for food lovers is New York City, New York (TripAdvisor)
- The top 3 destinations for big city lovers are: 1. Dubai, United Arab Emirates 2. London, UK and 3. Rome, Italy. The top US destination for big city lovers is Las Vegas, Nevada (TripAdvisor)
- The top 3 destinations for sun seekers because of pristine beaches and clear waters are: 1. Cancun, Mexico 2. Bali, Indonesia and 3. Crete, Greece. The top US destination for sun seekers is Oahu, Hawaii (TripAdvisor)
- The top 3 destinations for skiers are: 1. Zermatt, Switzerland 2. Jackson, Wyoming and 3. Banff, Alberta (TripAdvisor)
- Secluded mountain / rural escapes and waterfront getaways are the most popular vacation rentals of 2022 (Evolve)
- Only 15% of travelers booking vacation rentals are headed to urban areas in 2022 (Evolve)
- 27% of travelers favor international trips despite restrictions still in place (Evolve)
- There was a 4% rise in international tourist arrivals in 2021 from the previous year, meaning it was still down 72% from pre-pandemic levels (UNWTO)
- The pace of international tourism recovery has been uneven due to varying degrees of restrictions, vaccination rates and traveler confidence. Europe recovered 19% over 2021 and the Americas recovered 17%, while Asia and the Pacific arrivals fell 65% below 2021 levels (UNWTO)
- 71% of travelers who plan to stay in a vacation rental are vaccinated and 20% are unvaccinated ( Morning Consult )
- 7 of the 10 fastest growing destinations for spring 2022 (based on YOY growth) are outside the US (Trip Advisor)
- Paris, London and Rome are the top three trending international travel destinations for spring 2022 (Trip Advisor)
- Orlando, Florida will welcome the most visitors overall in spring 2022, and Hawaii will see the greatest YOY growth from spring 2021, likely the result of relaxing its travel restrictions (Trip Advisor)
- The top 5 most popular spring travel destinations are: Orlando, Florida; Las Vegas, Nevada; Cancun, Mexico; Key West, Florida; Miami Beach, Florida (Trip Advisor)
- The top 5 fastest growing spring travel destinations are: Honolulu, Hawaii; Paris, France; Lahaina, Hawaii; London, United Kingdom; Rome, Italy (Trip Advisor)
- 65% of leisure travelers did not travel internationally in 2020 (TripAdvisor)
- 47% of travelers globally say they plan to travel internationally in 2022 (TripAdvisor)
- 30% of travelers globally say won’t travel internationally in 2022 (TripAdvisor)
- 11% of travelers have already booked an international trip for 2022 and an additional 17% say they are researching international trips with the intent to book (TripAdvisor)
- 13% of US travelers have booked an international trip in 2022 (TripAdvisor)
- Hotel searches for trips in Jan-Apr 2022 are predominantly for domestic locations, while searches for trips in May-Dec 2022 are predominantly for international locations (TripAdvisor)
- 77% of travelers globally say they will be more likely to travel internationally, and 86% domestically, if they receive the COVID-19 vaccine (TripAdvisor)
- 34% of US travelers say they are much more likely to take an international trip in 2022 once they’ve received the vaccine (TripAdvisor)
- 26% of travelers globally, 30% of US travelers, say they will only travel to destinations that require visitors to be vaccinated before travel (TripAdvisor)
- 64% of people who plan to travel in 2022, plan to take 2+ domestic trips (TripAdvisor)
- 60% of people who plan to travel in 2022, plan to take local trips (TripAdvisor)
- In the first week of January, nearly 70% of hotel clickers on Tripadvisor were booking domestic trips (TripAdvisor)
- Globally, 74% of travelers plan to take at least one domestic trip, and 45% plan at least 2 domestic trips, in 2022 (TripAdvisor)
- 34% of US travelers are planning at least three domestic trips in 2022 (TripAdvisor)
- 56% of Americans have taken a staycation recently (YouGov)
- 2020 Google searches for “staycation” have jumped 45% YoY (Google)
- AAA estimates Americans will make 700 million car trips from July-Sept 2020 (AAA)
- Popular hotels are selling out nationwide during the pandemic. (CNN)
- Post-pandemic “revenge spending” indicates travel will be among the first industries to recover. (Forbes)
- Weekly pent-up demand for post-pandemic travel continues to grow . (TravelPulse)
- Top destinations in 2019 were predicted to be The Turkish Riviera, Egypt, The Peloponnese, Matera, Perth, The Scottish Highlands, St Barths, Arles, Valle de Guadalupe and New Orleans (CN Traveller)
- The Southeast region of the U.S. (Florida, Georgia, Louisiana) captured the largest share of domestic online searches for vacation lodging at 34% followed by the Far West (Washington, Oregon, California, Nevada) at 23%, the Mideast (New York, New Jersey, Maryland, Delaware, Pennsylvania) at 14%, the Southwest (Arizona, New Mexico, Texas, Oklahoma) at 11%, Great Lakes Region (Wisconsin, Illinois, Indiana, Michigan, Ohio) at 7%, Rocky Mountain Range (Idaho, Utah, Wyoming, Montana, Colorado) at 5%, the Plains Region (North Dakota, South Dakota, Nebraska, Kansas, Minnesota, Iowa, Missouri) at 3% and the New England Region (Vermont, New Hampshire, Rhode Island, Connecticut, Massachusetts, Maine) at 3% (US Travel Association)
- Top 10 U.S. destinations for travel agencies in 2018 include: Alaskan Cruises (47.9%), Orlando (38.6%), Las Vegas (35.4%), Maui (30.9%), NYC (27.7%), Honolulu (25.7%), Hawaiian Cruise (16.5%), Miami/Miami Beach (15.5%), Washington D.C. (14.7%), Los Angeles (12.9%) (Travel Leaders Group)
- Top 10 international travel locations for travel agencies in 2018 include: Caribbean Cruise (34.7%), Cancun (28.3%), Cruise – Europe (River) (23.1%), Cruise – Europe (Mediterranean) (17.4%), Punta Cana, Dominican Republic (17.2%), Rome (16%), London (15.5%), Amsterdam and Montego Bay, Jamaica (12.6%), Playa del Carmen/Riviera Maya, Mexico (11.4%), and Pairs (11.1%) (Travel Leaders Group)
- Most popular 2019 destinations for American travelers are Florida (17%), California (11%), New York (5%), Texas (5%), and Las Vegas (5%) (AARP)
- The top five summer road trip routes are: Las Vegas to National Parks, Northern California and Southern Oregon Coast, Northern New England, Blue Ridge Parkway in North Carolina, and Black Hills in South Dakota (AAA)
- Top 2019 international destinations include Europe (41%), the Caribbean (20%), and Asia and the Middle East (11%) (AARP)
- Iceland welcomed 2.2 million foreign travelers in 2017, with 32.9% of arrivals being in the winter months (Iceland Tourist Board)
- Australia is the number one international destination for solo travel (Booking.com)
- 38% of Millennial travelers are likely to visit a major metropolitan city in the next year (Resonance Consultancy)
- 50% of Americans, 89% of Indian people, and 69% of French people have traveled to at least one country of their ancestry (Forbes 2019)
- 40% of Millennial travelers are likely to visit a beach resort in the next year (Resonance Consultancy)
- Traveling to Mexico has dropped from 22% in 2017 to 9% for 2018 (AARP)
- Travel to the United Kingdom has dropped from 15% in 2017 to 6% for 2018 (AARP)
- Travel to Canada has dropped from 17% in 2017 to 4% for 2018 (AARP)
- 7% of millennials, 3% of Gen X and 6% of Baby Boomers expect to travel only to international destinations (AARP)
- 42% of Millennials, 51% of Gen X, and 51% of Baby Boomers expect to travel only to domestic destinations (AARP)
- 51% of millennials, 46% of Gen X and 43% of Baby Boomers expect to travel to both domestic and international destinations (AARP)
- 75% of people travel within the U.S. and farther than a bordering state (Travel Leaders Group)
- 39.8% of people travel internationally (Canada, Mexico, and/or Caribbean) (Travel Leaders Group)
- Last year international tourist arrivals worldwide reached 1.4 billion (Stuff)
- 39.5% of people travel within their home state (Travel Leaders Group)
- 33.1% of people travel to a bordering state (Travel Leaders Group)
- 24% of Americans travel internationally (Europe) (Travel Leaders Group)
- 35% of Americans, are planning to take a vacation of 50 miles or more away from home involving two or more immediate family (AAA)
- 55% of families have taken their children on vacation to Florida, 31% to California, and 26% to New York (NYU)
- 41% of travelers aged 65+, go on cruises for vacation (Solo Traveler)
- 43% of families have traveled to a National Park with their children for family vacations (NYU)
- Road trips represented 22% of vacations taken by American travelers in 2016 (MMGY Global)
- 53% of traveling families expect to pack up their cars for a road trip this year (Travel Agent Central)
- 57% of global travelers take a beach vacation (Trip Advisor)
- 56% of global travelers choose a destination to explore city history (Trip Advisor)
- 52% of global travelers go on vacation to visit family/friends (Trip Advisor)
- 26% of global travelers go on vacation to attend an event or festival (Trip Advisor)
- 25% of U.S. destination selectors say they actively research new trips at least once a month (Phocuswright)

Reasons & Decisions: Why People Travel & How They Decide
- The most popular reasons for travel cited by American travelers include: rest and relaxation (51%), escaping day to day life (49%) and visiting family and friends (44%) (Trip Advisor)
- 34% of travelers would be significantly less likely to travel if scientists determine Omicron is more resistant to current vaccines, 32% if scientists determine Omicron is more easily transmitted (MMGY)
- Vaccinated travelers are on average more cautious than unvaccinated travelers (MMGY)
- Business travel sentiment improved in February 2022 to 89% ( US Travel )
- Nearly 9 in 10 companies are planning business travel in the next 90 days (as of Feb 2022) ( US Travel )
- 82% of American travelers are excited to travel in the next 12 months—the highest level since the start of the pandemic ( US Travel )
- 82% of business travel organizations felt their employees were willing to travel in February 2022, up from 54% in January ( US Travel )
- 40% of US travelers want the feeling that they have made the most out of their trip (Expedia)
- 37% of US travelers admit to being less spontaneous since the onset of COVID-19, but 25% are willing to be more spontaneous and another 26% are aiming to be more flexible this time around (Expedia)
- 24% of travelers plan to spend less time on their devices and be more present (Expedia)
- 27% of travelers aim to spend more time at their destination in order to fully experience all it has to offer (Expedia)
- Of travelers who combine business and leisure travel into a trip consider this a major motivating factor: ( Morning Consult )
- Makes the trip more fun (46%)
- Less expensive fares because of flexible timing (43%)
- Visit friends and family more often (43%)
- Travel to places you couldn’t otherwise (44%)
- Save on costs because employer covers part (43%)
- Earn more loyalty/rewards points (37%)
- to relax (56%)
- to spend time with friends and family (56%)
- to escape/get away (55%)
- to experience adventure (27%)
- to improve mental health (27%)
- to seek out cultural experiences (19%)
- to check a location off a bucket list (15%)
- to spend time on one’s own (14%
- to attend a specific event (13%
- to experience luxury (9%)
- to improve physical health (8%)
- Is reliable or dependable (85%)
- Has good customer service and is responsive to problems (84%)
- Protects customers’ data, privacy and security (83%)
- They have a good safety record (83%)
- They make me feel secure and safe (83%)
- Consistently delivers on what they promise (82%)
- Is a good value for the price (82%)
- Treats customers well , even in tough times (82%)
- They regularly clean and sanitize (81%)
- Has always treated me well (80%)
- They mistreat passengers’ luggage or personal possessions (86%)
- They have surprise fees (85%)
- You had a bad experience with them or their customer service (85%)
- They do not follow clear safety precautions (85%)
- They had a data breach and your personal information was compromised (85%)
- They are known for not being reliable (84%)
- They do not regularly clean or sanitize (84%)
- 85% to see my child excited about the experience
- 82% to relax/reduce stress
- 81% to make memories
- 78% for fun, excitement, and adventure
- 73% to see or do something new
- 72% to see more of the world
- 66% to strengthen relationship with a significant other
- 65% to strengthen bonds with family and friends
- 60% to improve outlook on life
- 55% to learn something new about a place, culture or history
- 40% to continue a family tradition
- 35% to cross off an item on bucket list
U.S. travelers took 466.2 million domestic trips for business, and 1,779.7 million for leisure (Statista). That compares with 458.9 million domestic business trips (Statista) and 1,745.5 million domestic trips for leisure purposes (Statista) in 2016
International arrivals to the U.S. totaled 79 million in 2019, about half of whom came from overseas ( US Travel Association )
U.S. residents logged 1.9 billion person‑trips* for leisure purposes and 464.4 million person-trips* for business * Person-trip defined as one person on a trip away from home overnight in paid accommodations or on a day or overnight trip to places 50 miles or more away from home ( US Travel Association )
U.S. residents logged 463.9 million person‑trips (one person on a trip away from home overnight in paid accommodations or on a day or overnight trip to places 50 miles or more away from home) for business purposes, with 38% for meetings and events (US Travel Association)
42% of people travel to visit friends/relatives, 8% for outdoor recreation purposes, 13% for entertainment/sightseeing, 15% for other pleasure/personal reasons, 3% for conventions/conferences/seminars, 7% for general business purposes and 4% for other reasons (US Travel Association)
81% of travelers consider it very important for brands to provide personalized experiences to their customers ( Travolution )
84% of Millennials and 73% of non-Millennials are likely or very likely to plan a trip based on someone else’s vacation photos or social media updates. ( APM Agency )
37% of Millennials have had their holiday destination influenced by social media and 34% have booked a holiday because of content seen on social media. ( WeSwap )
Leisure travelers ages 18–34 are 2.4x more likely than those ages 35 and over to discover travel destinations via mobile. ( Facebook )
89% of Millennials plan travel activities based on content posted by their peers online. ( Entrepreneur )
31% of Millennials said that posting holiday pics online is just as important as the holiday itself, and 29% wouldn’t choose a holiday destination if they were not able to post on social media while there. ( WeSwap )
42% of Millennials stress about taking the perfect photo for social media during vacation ( Value Penguin )
Top getaways travelers haven’t done before because they are too afraid, but would love to try include: volunteering trip (39%), gourmet adventure (38%), mystery trip (38%), sabbatical trip (36%), and an ancestry trip to find out about their heritage (36%) ( hospitalitynet )
51% of people travel to recharge their batteries when they feel stressed, busy, and tired (Intrepid Adventure Travel Index)
59% of solo travelers said the reason they travel alone is because they want to see more of the world and they’re not willing to wait for others (Solo Traveler)
45% of solo travelers like the freedom to do what they want when they want while traveling (Solo Traveler)
47% of millennials and 40% of generation Z travel to relax and avoid stress (WYSE Travel Confederation)
One in two (55%) travelers think the best thing about travel is getting out of their comfort zone (hospitalitynet)
One in five people plan to take health and well-being trips (Yoga and Meditation Retreats, Weight Loss and Fitness Retreats, etc.) in 2018, almost double the amount of people compared to 2017 (Booking.com)
95% of family travelers said their priority was keeping their families entertained and happy (Short Term Rentalz 2019)
89% of family travelers said their priority was deals and value of the vacation (Short Term Rentalz 2019)
85% of family travelers said their priority was planning travel around school holidays (Short Term Rentalz 2019
85% of families said their priority was being near major attractions or theme parks (Short Term Rentals 2019)
49% of families said their main priority when they take a family vacation is to visit new places and explore together, 42% to relax and unwind together, and 6% to be active and outdoors together (NYU)
45% of global travelers start their booking process by deciding on a specific destination (Trip Advisor)
77% of families said that “best value/price for our budget” was the most important factor when deciding where to stay on vacation (NYU)
28% of Millennials trust social media about travel providers over magazines, television and Google and TripAdvisor reviews. ( WeSwap )
25% of families had used a travel agent and 75% hadn’t for their family vacations in the past five years (NYU)
59% of families said travel websites (TripAdvisor, Expedia, etc.) were resources they used for information or inspirations for where to go and what to do, 10% said Instagram, 74% said search engines, 51% said travel review websites, 30% said social media, 12% said travel agents, and 8% said blogs (NYU)
58.2% of travelers used any user-generated content to help plan their leisure travel, 32.5% used reviews from hotel, 29.6% used travel reviews of destinations, 30.8% used reviews of restaurants or activities, 13.5% used travel itinerary or blogs, 33.3% used Facebook and 26.3% used group discount websites (Destination Analysts)
56% of solo travelers said the top factor they look for in a destination is safety (Travel Agent Central)
More than 40% of business trips in the past year have included a leisure portion added on (Expedia Media Solutions)
64% of Millennials prefer booking on travel websites for hotels, 47% prefer booking through specific hotel, resort and airline websites, and 24% prefer to book through travel agents (Resonance Consultancy)
79% of travelers who use a smartphone complete a booking after researching on their smartphones (Think With Google)

Travel Activities: What People Do When They Travel
- Half of leisure travelers are at least somewhat interested in taking a cruise in the next 12 months (MMGY)
- 41% of US travelers are seeking excitement/exhilaration on their next trip (Expedia)
- 11% of travelers are willing to try daring or high-adrenaline activities (Expedia)
- 24% of travelers are looking for an unforgettable night out (Expedia)
- 21% of travelers are most excited to try experiences they would usually never do, like: sleeping under the stars (19%), travelling alone (17%), skinny-dipping (11%) or having a vacation romance (10%) (Expedia)
- 61% of travelers are most interested in outdoor activities (like hiking, biking and kayaking) and wellness/relaxation experiences (Evolve)
- Travelers over 40 are more likely to travel with a significant other or multiple generations of family. Travelers under 40 are more likely to travel with a group of friends or solo (Evolve)
- When planning trips for 2022, US travelers feel that “new” is important: ( Trip Advisor )
- Seeing new places (75%)
- Having new experiences (71%)
- Going out to restaurants/trying new food (69%)
- Meeting new people (35%)
67% of high-income travelers said they would rather spend their vacation money on activities than a nicer hotel room ( Skift )
65% of travelers visited art/history museums, 59% aquariums, 56% science museums, 55% theme parks, and 55% zoos in 2017 (MMGY Global)
54% of travelers go shopping during their summer vacation, 49% visit historical sights, 49% go swimming or do water sports, 46% go to a park or national park, and 46% go on sightseeing tours (Statistic Brain)
21% of travelers who use social media for inspiration when researching trips are looking for info on attractions. ( WebFX )
Those who get tickets to watch athletic events while on vacation pay about $180 annually while those who play sports, like golf, while on vacation, spend about $640 per year ( Value Penguin )
Average entertainment costs, if incurred by vacationing households: $640 for participant sports, $541 for movies and other admissions, $180 for tickets to sporting events, $250 for other recreation expenses and $250 for other entertainment services ( Value Penguin )
Travel activities account for 8% of U.S. travel gross bookings and the segment comes in third by size behind hotels and flights (Phocuswright)
The U.S. travel activities market totaled $34 billion in 2018, and growth is outpacing the total travel market (Phocuswright)
More than three in four activities booked in-destination happened on the day of or day before the activity (Phocuswright)
Mobile searches for “things to do/activities” + “near me” have seen a 6X increase over the last two years. ( Think with Google )
Searches for activities are happening across devices in the three months prior to a trip, but shift significantly to 54% mobile when travelers are in-destination (Google)
35% of travelers have used mobile phones to book a tour or activity while already at a vacation destination ( Skift )
Travelers tend to book expensive activities more in advance compared to cheaper activities ( Tour Scanner )
85% of consumers use their phones to book travel activities, including restaurant reservations and sightseeing tours. ( MDG Advertising )

Other Travel Statistics
- US airlines are projecting 150% as many passengers to fly in 2022 as did in 2021 (IATA)
- 3.4 billion passengers are projected to fly in 2022, up from 2.3 billion in 2021, but still down from 4.5 billion in 2019 ( IATA )
- In 2022 overall demand for flights is expected to reach 61% of pre-crisis (2019) levels. Capacity is expected to continue to increase faster than demand, reaching 67% of pre-crisis levels for 2022 ( IATA )
- In 2022, demand for domestic flights is expected to reach 93% of pre-crisis (2019) levels ( IATA )
- In 2022, demand for international flights is expected to reach 44% of pre-crisis (2019) levels ( IATA )
- Air travel in January 2022 (measured in RPKs) was up 82.3% compared to January 2021, but down 4.9% compared to the previous month (December 2021) ( IATA )
- January 2022 domestic air travel was up 41.3% compared to January 2021, but down 7.2% compared to December 2021 ( IATA )
- January international air travel was up 165.6% compared to January 2021, but down 2.2% compared to December 2021 ( IATA )
- Hotel demand in January 2022 was 9% below 2021 levels ( US Travel )
- Nearly 1 in 6 job openings in the US are in leisure and hospitality ( US Travel )
- Overseas arrivals fell to 65% below 2019 levels in January 2022 ( US Travel )
- Leisure & hospitality accounts for 61% of all jobs still lost since 2020, and is recovering more slowly than the rest of the economy ( US Travel )
- Of the 10.9 million job openings in the US at the beginning of 2022, roughly one in six, or 1.7 million, were in leisure & hospitality alone ( US Travel )
- 58% of tourism professionals predict a travel rebound in 2022 (mostly in the third quarter) and 42% predict the rebound won’t happen until 2023 (UNWTO)
- 64% of tourism experts predict international arrivals will return to pre-pandemic levels in 2024 or later (UNWTO)
- 2020 was the worst year on record for tourism and 2021 the second worst year on record (UNWTO)
- US adults say travel brands should definitely take these precautions: ( Morning Consult )
- clean/sanitize common areas (71%)
- clean/sanitize private customer areas (70%)
- publicly share info about COVID-19 protocols (55%)
- allow for physical distancing (49%)
- require employees to wear masks (48%)
- require customers to wear masks (41%)
- use tech to minimize interactions (39%)
Most families own or lease the vehicles they use for road trips, but about 2% rent a car or truck on vacation and spend an average of $1,223 ( Value Penguin )
Despite their cultural prominence, only 0.5% of Americans travel via RV (recreational vehicle) ( Value Penguin )
Travel website cart abandonment rates are 81.6% which is higher than the overall average of 76.8%. ( SaleCycle )
Booking abandonment rates on hotel websites are 78.3%, with the most common reasons around research and price comparison ( IMPACT )
The U.S. travel market grew 5% in 2018, with gains remaining steady in 2019; by 2022, total gross bookings will have increased to $441 billion (Phocuswright)
90% of travelers now have apps to make their life easier when at their destination with maps, airlines, weather and social media (Travelport)
55% of global travelers report being more determined to make sustainable travel choices than they were a year ago (Booking.com)
73% of global travelers intend to stay at least once in an eco-friendly or green accommodation when looking at the year ahead (Booking.com)
70% of global travelers say they would be more likely to book an accommodation knowing it was eco-friendly, whether they were looking for a sustainable stay or not (Booking.com)
More than 60% of travelers would consider an impulse trip based on a good hotel or flight deal (Think With Google)
Plane and car are preferred modes of transport for family travel, with 52% selecting their mode of transport by the fastest option, and 34% based on lowest cost (Expedia Group)
The primary mode of transportation for domestic and international travel are: plane (66% domestic & 87% international), cruises (5% domestic & 35% international), train (6% domestic & 16% international), rental car (24% domestic & 14% international), personal car (60% domestic & 13% international), and buses (2% domestic & 10% international) (AARP)
Millennial’s are more likely to bring work with them on trips than Baby Boomers (78% versus 59%) (AARP)
51% of US travelers said that once they decided to go on a trip, they would spend less than one week researching flights (Facebook IQ)
Hotels and flights are booked in advance of 12 weeks and within the 3 months prior to the trip date (Google)
Gen Alpha (those born after 2010) is showing more signs of influencing family travel decisions and planning (Short Term Rentalz)
On average globally, travelers with Gen Alphas are taking more than three family trips a year (Expedia Group)
Online will account for the lion’s share of travel sales at 52%, with mobile sales representing a quarter of all travel bookings (Euromonitor International)
International arrivals are expected to amount o 1.8 billion trips by 2024, and domestic tourism is expected to reach 19 billion (Euromonitor International)
74% of consumers say experiencing things in the real world was a priority for them in 2019, with Baby Boomers being the most experiential and Gen Z being less so by 15% (Euromonitor International)
43% of global consumers say they prioritize experiences over things, while 78% value real world experiences in 2019 (Euromonitor International)
Got Travelers of Your Own?
We at Access Development know a thing or two about wholesale travel benefits and the white-label travel platforms used to increase member engagement. Contact us and learn about our private travel network for groups and organizations. Whether it’s deep discounts or cash-back travel rewards of up to 50% on hotel bookings, car rentals, theme park tickets and more, Access has the platform you need to offer your travelers unparalleled worldwide value.
Source https://www.travelinsurancereview.net/2010/05/09/where-could-i-stay-in-europe-travel-to-many-countries/
Source https://www.huffpost.com/entry/where-europeans-go-for-summer-vacation_n_5b170897e4b09578259caa0d
Source https://blog.accessdevelopment.com/tourism-and-travel-statistics-the-ultimate-collection